
MY ROLE
- User Research
(interviews, desk research, stakeholder workshops)
- End-to-End UX/UI Design
- Usability Testing & Iteration
- Design System Alignment
- Cross-functional Collaboration (Product, Developers)
- Design Handover & QA
PROJECT DURATION
- 10 Months (Discovery -Launch)
- 2025
CLIENTS
- VolksbankPur
- Sparkasse, and Partners

LIVE VERSION - GECCO2
LIVE VERSION - PROECO
PROJECT DURATION
- 10 Months (Discovery -Launch)
- 2025
CLIENTS
- VolksbankPur
- Sparkasse, and Partners

Digital CO₂ Solution for Volksbank Pur

Trend


0.005
0.004
0.003
0.002
0.001
0.000
0.005
0.004
0.003
0.002
0.001
0.000
6 Months
1 Year
5 Years
10 Years
2020
2022
2023

2019
2021

Month CO2e (t)
Period/Year CO2e (t)
Time





Month

Period/Year

Period/Year (Jan 2024 - Sep 2024): 123.23 t

Month (Jan 2021): 0.0030 t
Your industry comparison
Calculated with bwa_example.pdf
Result

Industry average
Your result





3,056.20 t CO2e


30%
4,000.20 t CO2e
1,300.20 t CO2e
50%
6,213.20 t CO2e
950.20 t CO2e

895 t CO2e
50%
20%
55%
45%
CO2 emissions

per employee

per €100,000 revenue


Download CO2 balance

800 trees


Calculation CO2 balance
Upload BWA
Extracted data

Result
Result history
Scope 1


Scope 2


Scope 3


would need to be planted to offset your CO2 balance
DEVELOPED FOR


Gecco2 is a digital sustainability assistant that enables small- and medium-sized enterprises (SMEs) to quickly calculate, analyze, and monitor their CO₂ emissions using their existing financial documents (BWA). This project was launched in collaboration with VolksbankPur and later extended to Sparkasse (ProEco), providing their SME clients with a simple, certified tool to support their sustainability journey and regulatory requirements.
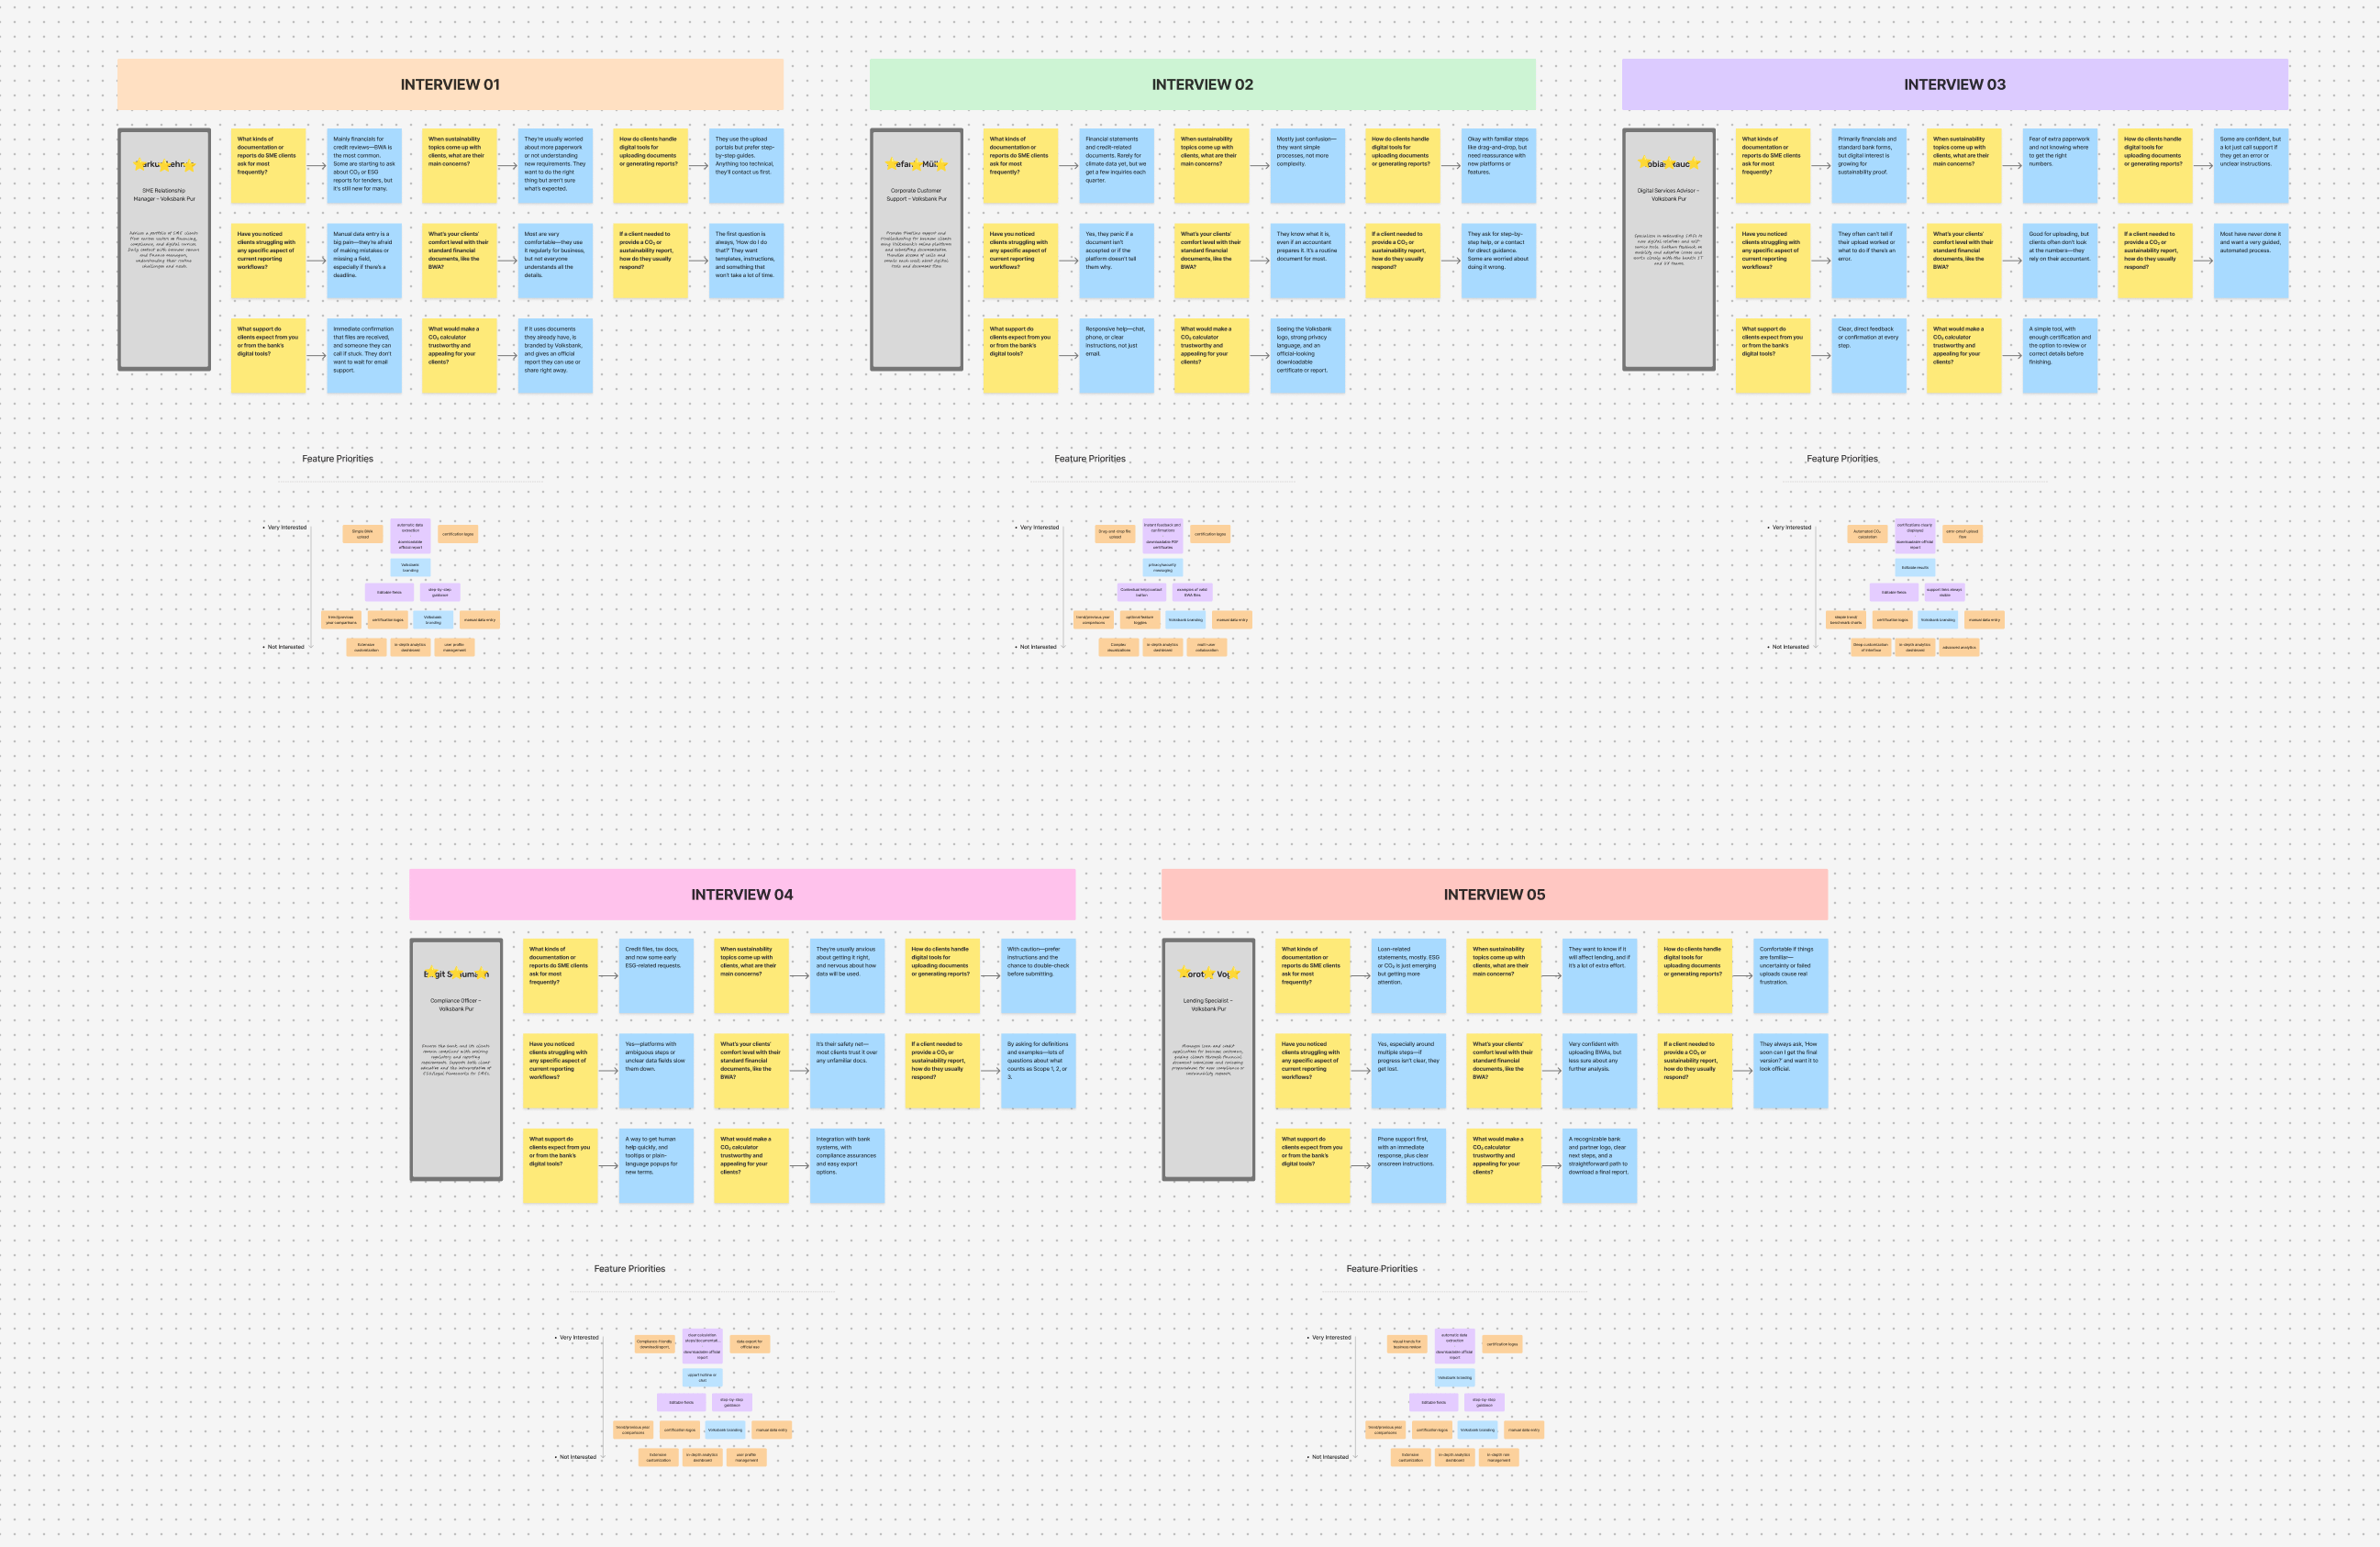
I started out with a series of interviews with Volksbank Pur staff to understand firsthand their clients’ pain points and expectations regarding CO₂ reporting. I then documented key responses from these interviews, along with insights from additional research, and categorized them into clear feature priorities:
After conducting the stakeholder interviews and synthesizing the key insights, I started out by creating a user journey map to visualize each stage of the User’s experience with Gecco2 —from initial contact by the bank, through registration and BWA document upload, to receiving and sharing their CO₂ report. This helped me identify key pain points, emotional highs and lows, and opportunities for improving clarity and ease-of-use across the entire customer journey.
Here, I focused on illustrating the exact journey a user would follow within Gecco2 and ProEcco— from landing on the platform, registering, uploading their BWA, and reviewing extracted data, to downloading their certified CO₂ report. This allowed me to pinpoint where users might need extra guidance, and refine the flow so even non-technical business clients could complete the process smoothly and with confidence, all in just a few intuitive steps.
After defining the user flow, I structured the information architecture to group related tasks together and keep the interface intuitive. Here, I defined clear modules for CO₂ calculation, result history, data trends, optimizations, and account settings—making sure every function was logically placed and that users could always find what they needed with minimal clicks.

End user’s journey map
Project brief
Analyse &
Synthesise
Define
opportunities
Research to
understand
the problem
& users


Research
Analyse

End user
actions
Service
Phase
Tasks
Thoughts& emotions
Recommend-ations
- Filling personal info.
- Checking email
- Clicking a link
- Check the result
- Filling missing parts
- It is hussle that I have to compare BWA with the system
- It says it is inaccurate and my rate is quite low. I don’t think i can use it.
- I have to fill in all again. Why did I need to upload BWA?
- I can not go back
- The result looks good finally
- can I just send it over directly?
- Giving two options: A: BWA / B: Input filed with info. Benefit of using BWA
Banefit of inputting
- Option to open BWA you just uploaded
- Feature for direct sending over
- Inputting data manually
(amount of usage)
- Clicking next
- Check the data
- Donloading the result
- Open my folder
- Open my email & send
- Click to upload
- Waiting until it is complete
VB company
consultant
Receiving
Link
Sales:
email, phone calls
Registration
Upload BWA
Showing
the result
Clink to improve the accuracy
Showing the result
Sending it over




Before
Begining
During
After
🙂
🙂
🙂
🤯
🤔
🤔
😊

Project brief
Analyse &
Synthesise
Define
opportunities
Research to
understand
the problem
& users


Research
Analyse
Landing page
Start / End
Home screen
Upload &
calculate BWA
Manual review
Screen
Choose a file
or
Select a file
Show the result
or
Return
Upload
Show the result
Select
Return
- Payment pop-up
- Company profle
- Filling information
- Waiting
- Waiting

Registration
Calculate
your co2
Start
calculation
Save on
computer
Decision

Action


Result page
pop-ups
Download
or
Improve
Download
Improve
Scope 1
Scope 2


Business clients of Volksbank Pur and Sparkasse (especially SMEs) needed an intuitive, trustworthy way to assess and track their company’s CO₂ footprint, especially with evolving ESG reporting standards and increasing pressure from partners, clients, and regulators. Traditional CO₂ calculators were either too complex, manual, or inaccurate for the average business owner or finance manager.
1. Project Overview
2. The Challenge
- UNDERSTANDING THE USER
- DISCOVERY & INSIGHT GENERATION
- GETTING TO WORK
THE PROBLEM
TARGET AUDIENCE
CUSTOMER JOURNEY MAPPING
CUSTOMER USER FLOW
INFORMATION ARCHITECTURE
USER & STAKEHOLDER INTERVIEWS
BUSINESS GOALS

Provide an easy-to-use, self-service platform for Volksbank Pur and Sparkasse
clients to generate certified CO₂ reports from their standard financial documents.
Position Volksbank Pur and Sparkasse as digital innovators by integrating
sustainability into their value-added services.
Help businesses comply with ESG and supply chain reporting requirements without
needing additional external consulting.
Business owners, accountants, and finance managers of small and medium-sized
enterprises who are customers of Volksbank Pur or Sparkasse.
Typically non-specialists in climate or sustainability topics, focused on practical
business outcomes.

Project brief
Analyse &
Synthesise
Define
opportunities
Research to
understand
the problem
& users


Research
Analyse
Landing page
contact VDS
Log in
Start Caculate Co2
Profile / Name
Upload BWA
Password change
picture and name change
Choose picture
Password setting pop ups
Change plan
pop ups
Quitting Subscription
pop ups
company profile change
pop ups
Payment change
pop ups
Subscription change
Quitting Subscription
Company profile
List of receipts
download
contact detail
Search
FAQ
Payment
Calcurate co2 emission
Extracted data
Calculation result
Result / improvement
Extracted data analysis
Result analysis

Improvement pop-ups
Last calculations
Result history
Setting
Rechnungen
Support
Trend
- Moved from setting
- Inactive
- Deleted






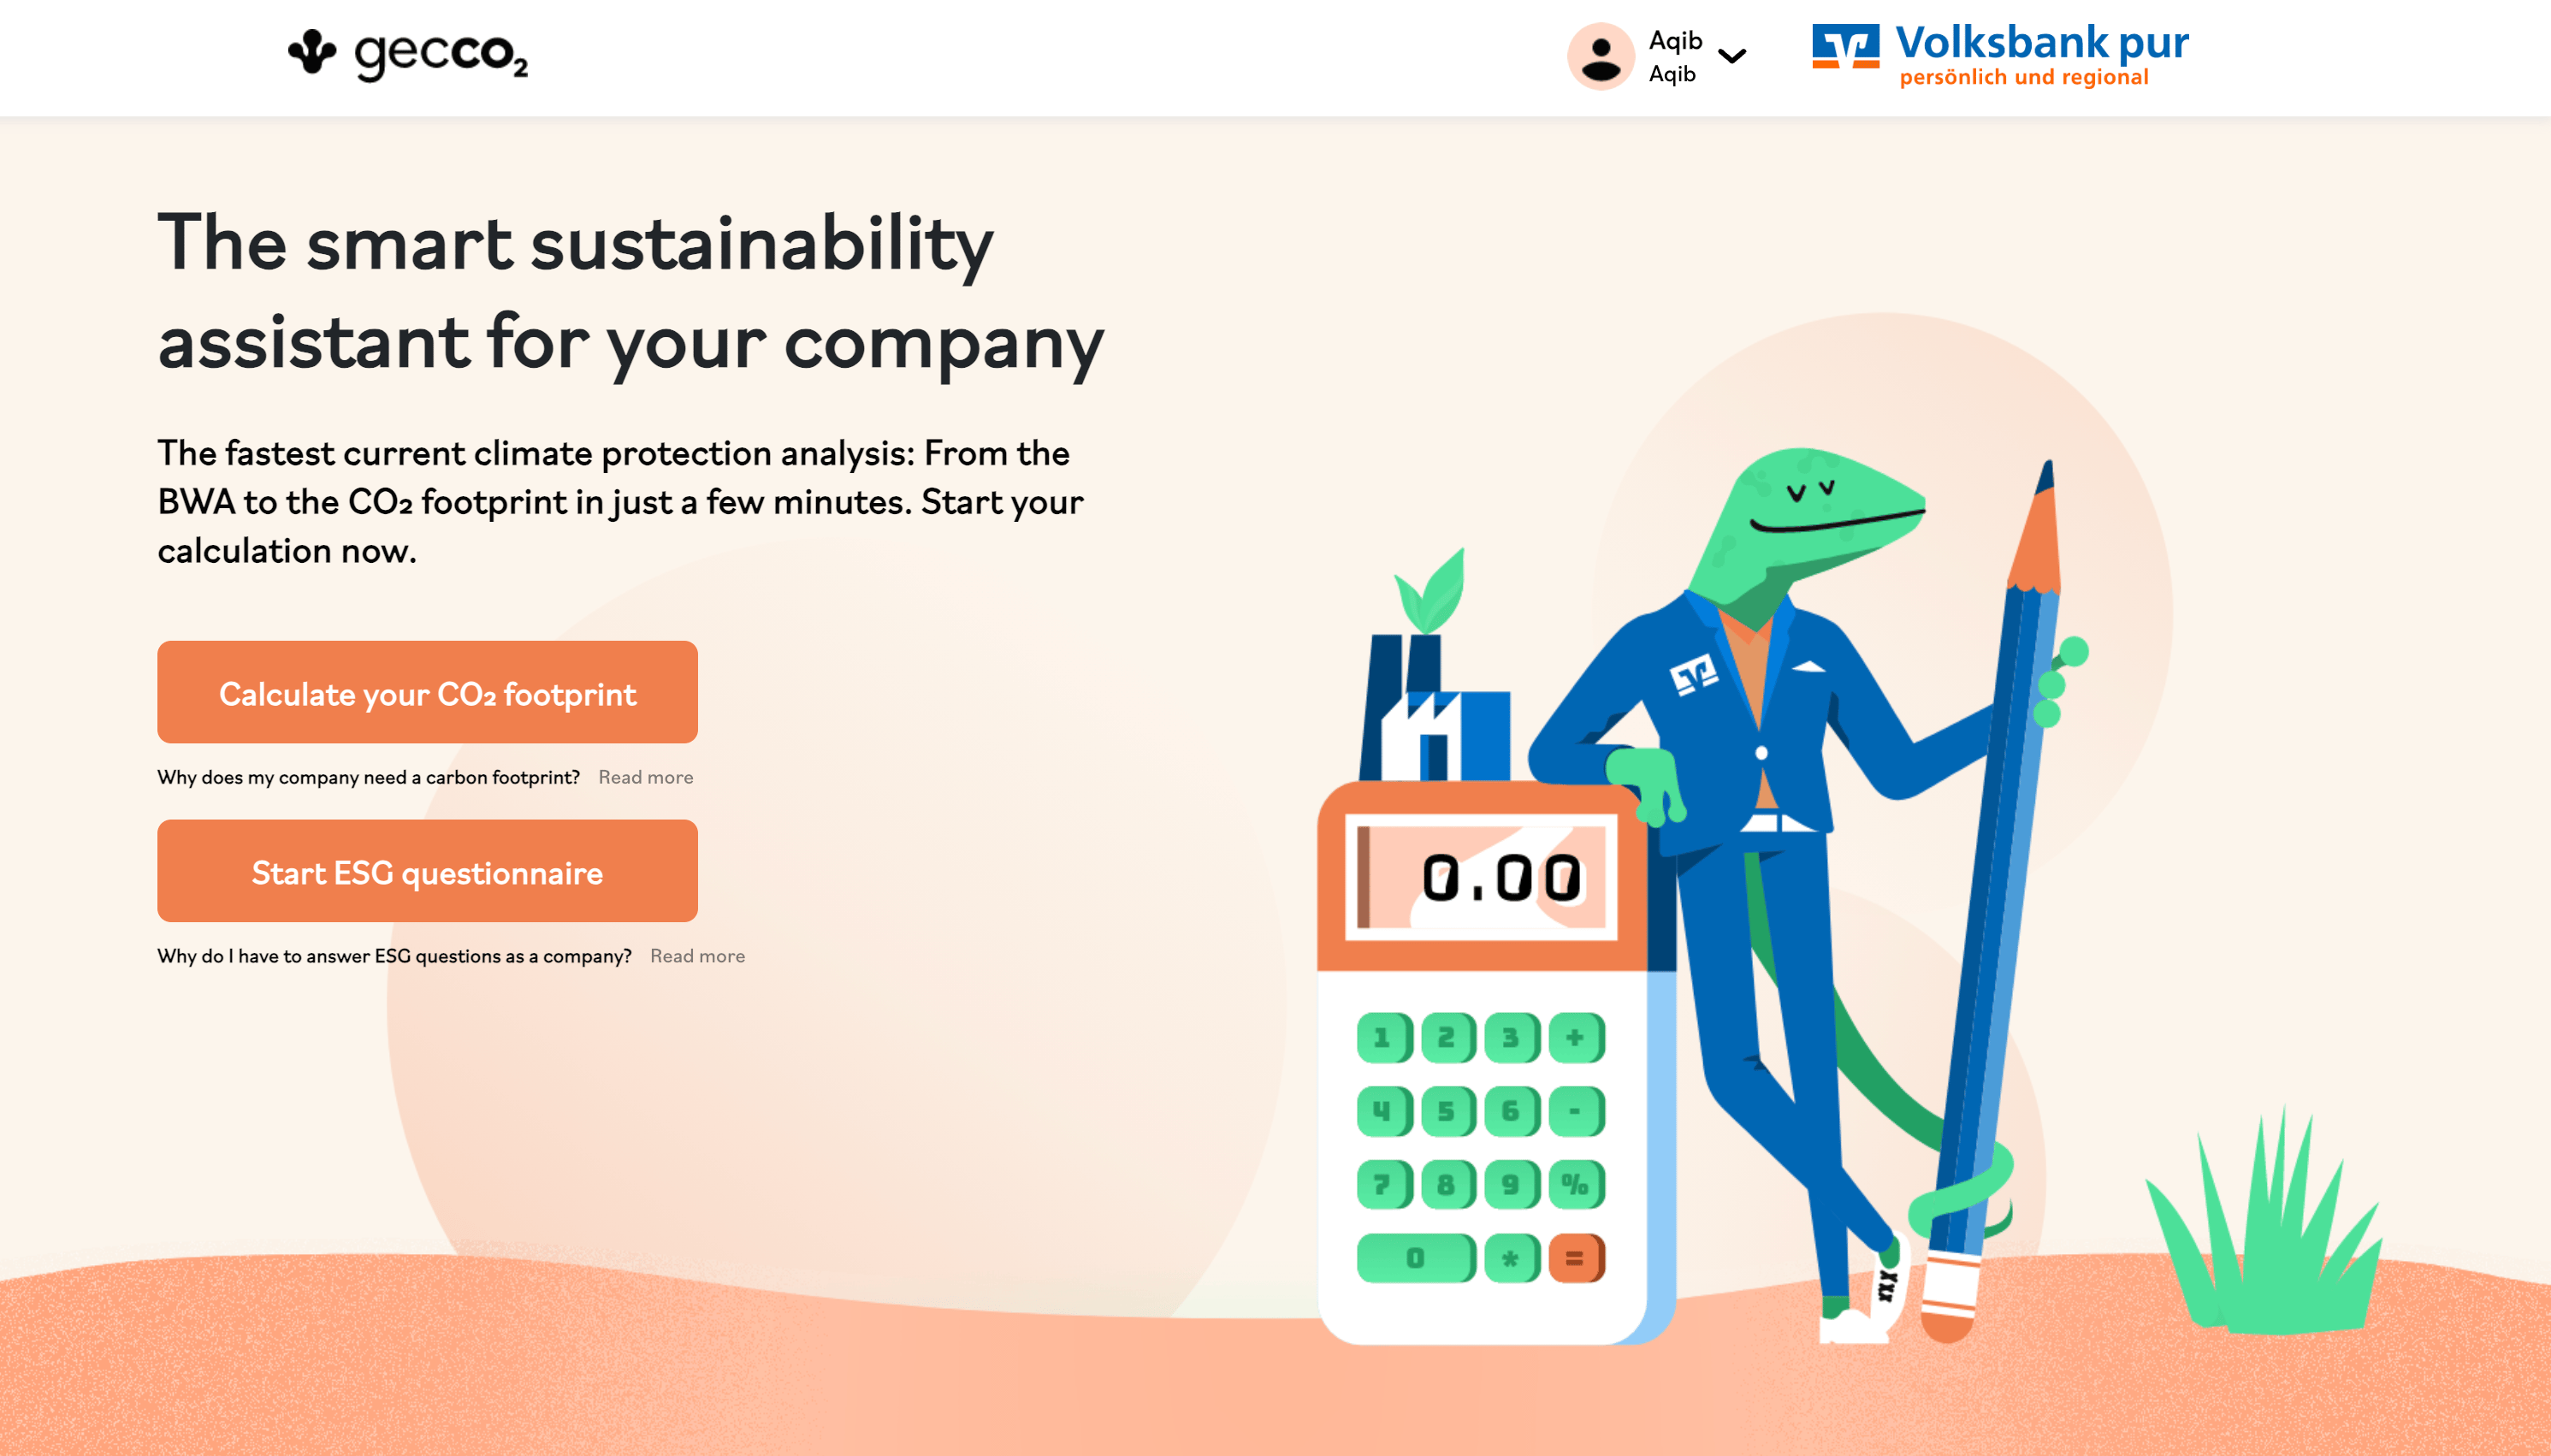
After finalizing the information architecture and sketching wireframes to define the skeletal structure of the platform, I began designing the core entry screens: the landing page, contact, and login screens. On the header navigation, users can immediately access “Contact” and “Login” for support or account access. The hero section includes a brief description of the platform’s benefits and a “Calculate CO₂ footprint” button that serves as the main entry point into the calculation workflow:
Once the user clicks the "Calculate CO₂ footprint" button, the user is redirected to the Upload BWA Screen where they can submit their BWA financial statement as a PDF. This document is then used to extract relevant financial data and automatically calculate the company's CO₂ emissions:
On the Trend Screen, users can see and compare their company’s CO₂ balance across different time periods—like 1 month, 6 months, 1 year, 5 years, or 10 years by switching though the tabs on top of the chart. The graph displays two lines: the orange line tracks your monthly CO₂ balance, while the green line shows the average over a selected period:
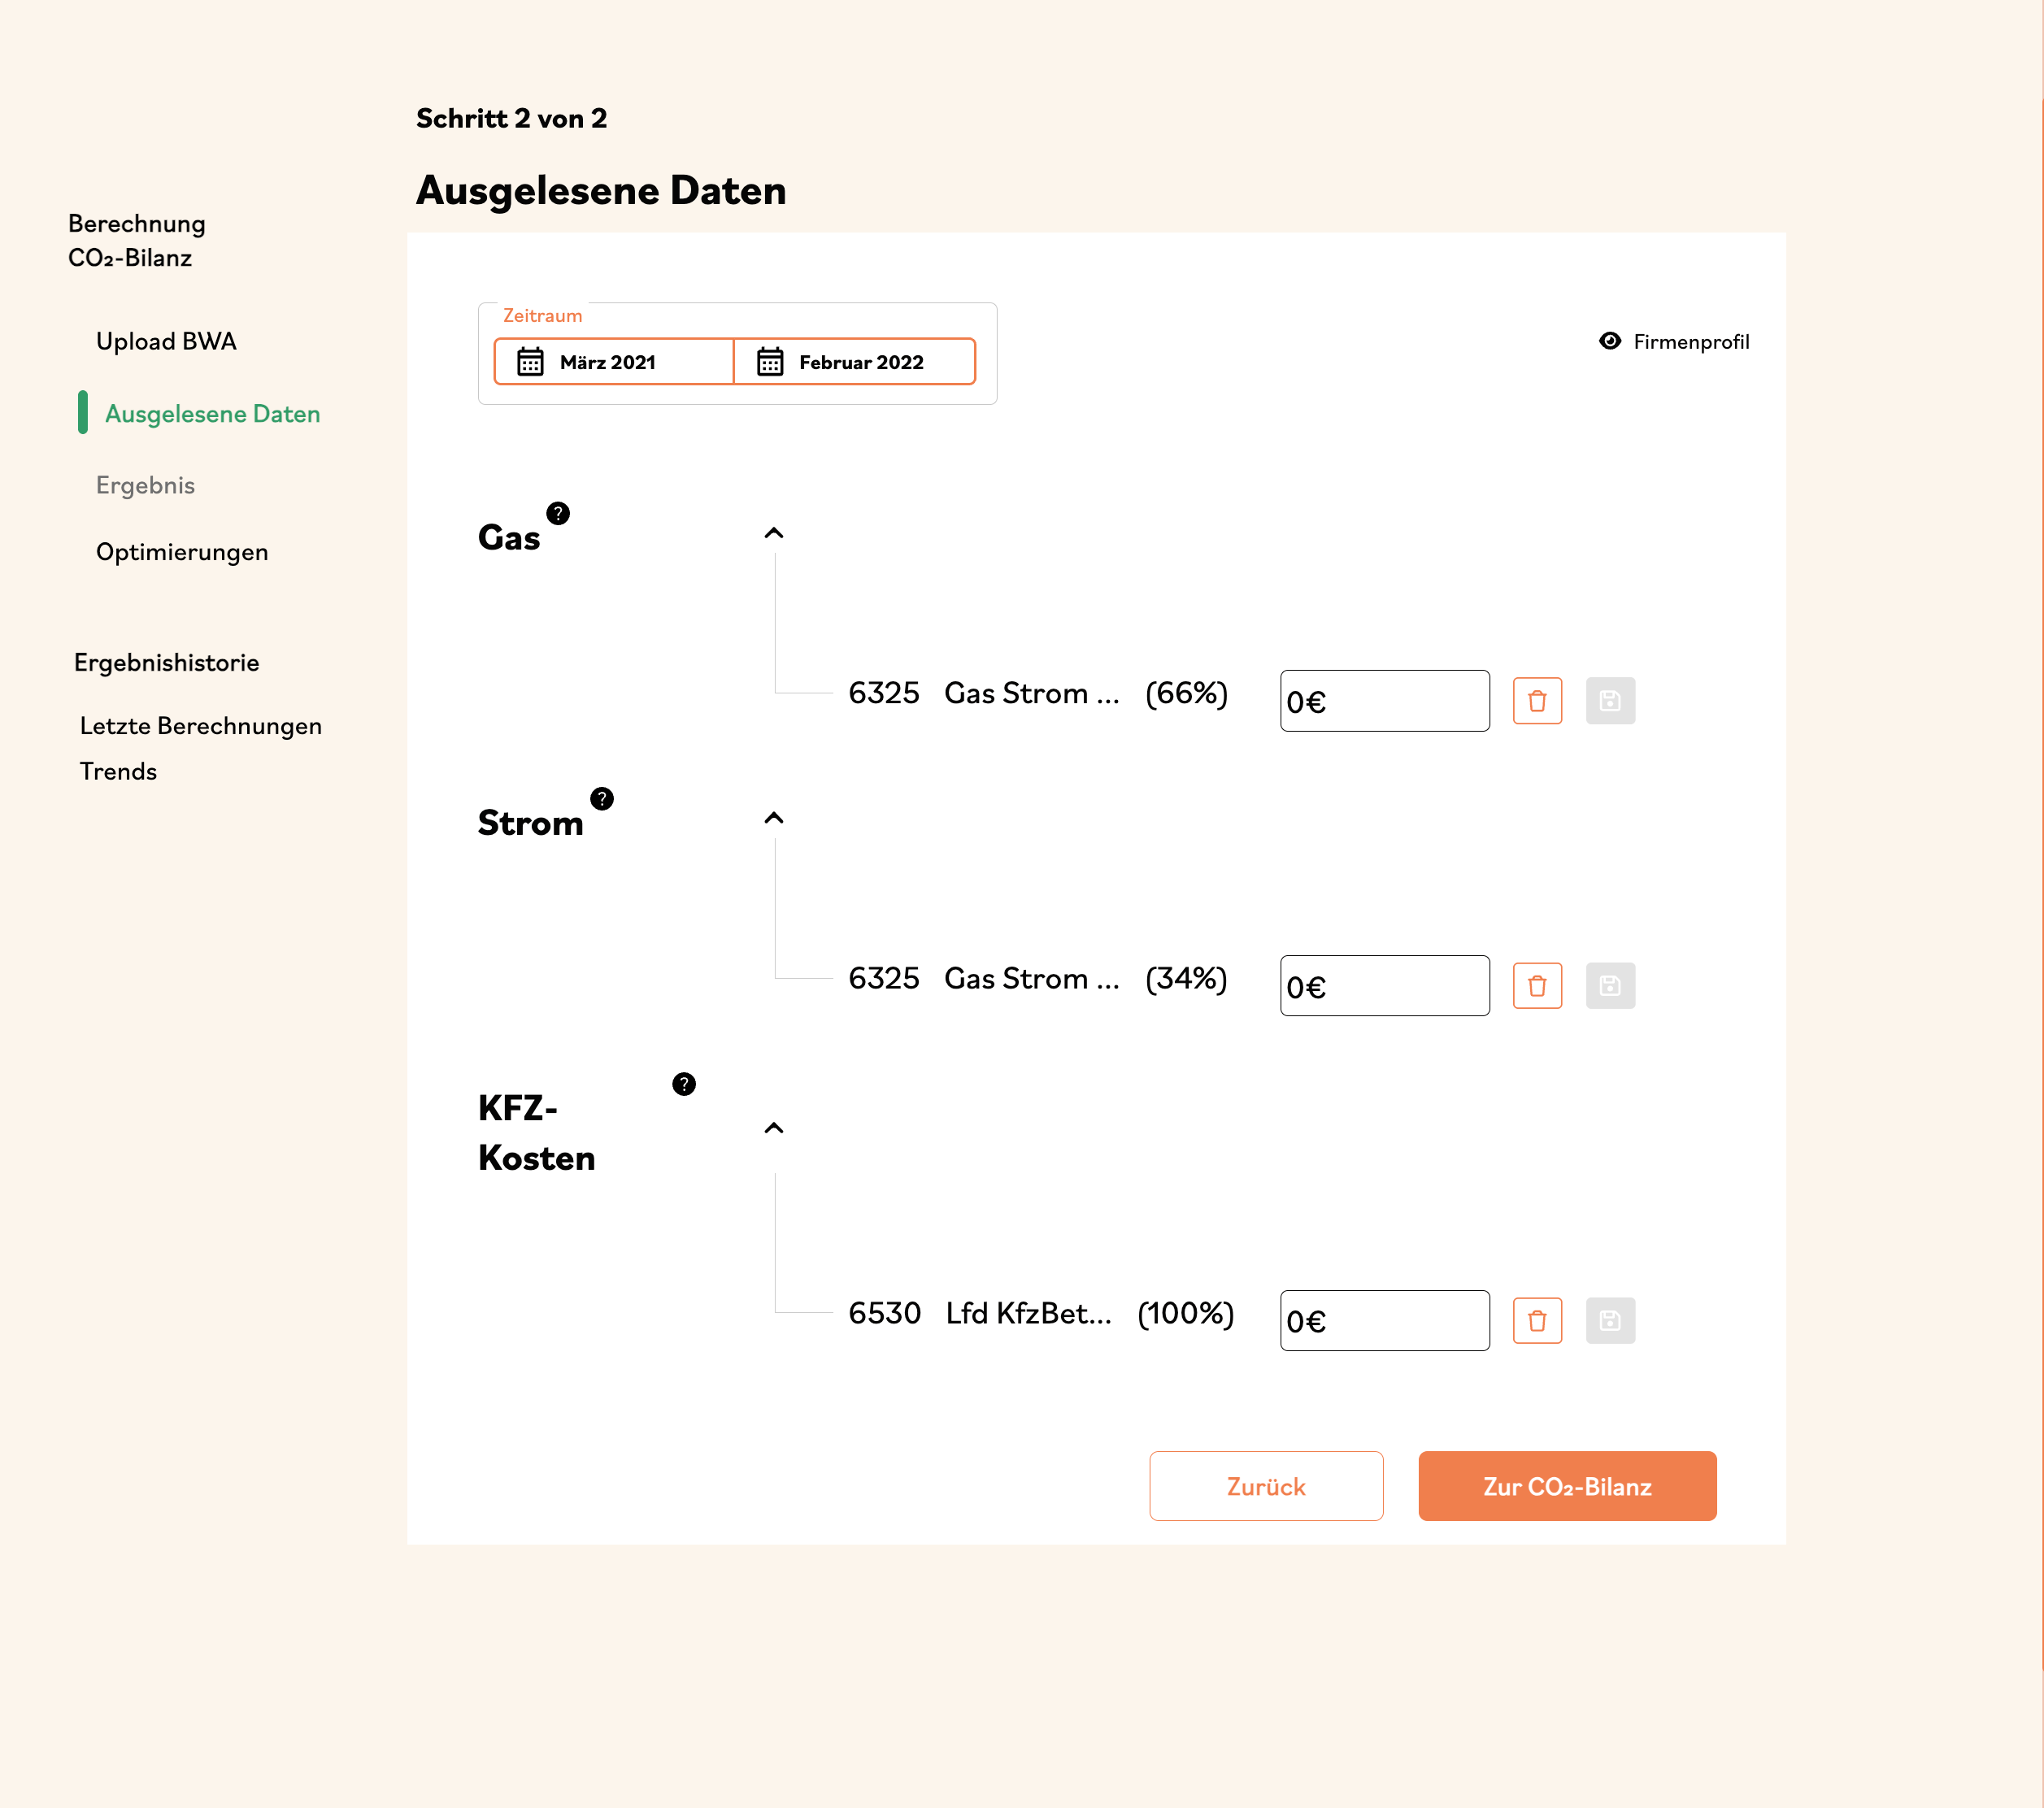
After the user uploads their BWA financial statement, they are taken to the next screen where all relevant data automatically extracted from the BWA document is clearly displayed. Data for categories such as Gas, Electricity, Oil, and others are pre-filled, and the user can also select the reporting period directly from the calendar:
After verifying and adjusting their extracted data, the user arrives at the results screen. On the results screen, users see their total CO₂ balance clearly divided into Scopes 1, 2, and 3. Each section provides a breakdown of emission sources and indicates the accuracy or status of the data. Users can compare their results against industry benchmarks and instantly download a comprehensive CO₂ report:








1
4
7
0
2
5
8
3
6
9
*
=
+
-
%

0.00


Learn more

The smart sustainability assistant for your business
The fastest current analysis for climate protection: From the financial statement to the carbon footprint in just a few minutes. Start your calculation now.
Login
Contact
Calculate CO2 footprint
Landing Page
Upload & evaluate BWA
Step 1 of 2

S. Jones
Weber Logistics


Drag & drop your BWA here
or use the “Select File” button.
Please use a .pdf format.


Select previously uploaded file

Select file

Select file
Calculation
CO2 balance

Upload BWA
Result history
Upload BWA Screen 1
Trend

S. Jones
Weber Logistics

Calculation
CO2 Balance
Upload BWA
Result History

Trend


0.005
0.004
0.003
0.002
0.001
0.000
1 Month
6 Months
1 Year
5 Years
10 Years
2020
2022
2023

2019
2021

1 CO2e
Time





0.003
Feb, 2021


CO2 Balance Period
CO2 Balance Month

Trend Screen
-
October 2022


Extracted Data
Step 2 of 2

Calculation
CO2 Balance

Extracted Data
Result History
Company Profile
eye

S. Jones
Weber Logistics

Gas

3,000
£
Electricity
Oil

Business Trips


4,240
Electricity, Water (x%)
2,000
£
3,987
Position Text (x%)
6,000
£

4,240
Electricity, Water (x%)
1,500
£
3,987
Position Text (x%)
Vehicle Costs

4,500
£
3,987
Position Text (x%)
1,500
£

4,923
Energy Sources (x%)
500
£
9,294
Heating Oil (x%)


To CO2 Balance

Back
save
trash
save
trash
save
trash
save
trash
save
trash
save
trash
save
trash


Extracted Data - Full View
Your CO2 balance
Calculated with bwa_example.pdf



Download CO2 balance
CO2e
for March 2021
11,155.68 t
4,000.20 t
4,000.20 t
2,906.20 t

Scope 1

Scope 2

Scope 3


Impacts


Scope 1
Direct emissions

4,000.20 t CO2e
Exact

Scope 1.1 Direct emissions from combustion processes of stationary plants (heating oil, natural gas)
Source: BWA
Preliminary
5.37 t CO2e
Scope 1.2 Direct emissions from fuel consumption of owned vehicles (leasing and ownership)
Source: BWA
Accurate
5.67 t CO2e
Scope 1.3 Direct emissions from volatile gases, leaks, and faulty piping when using air conditioning systems
Source: BWA
Very accurate
-- kg CO2e
Scope 1.4 Direct emissions from specific production processes (relevant for only a few industries)
Source: BWA
Preliminary
0.075 t CO2e


Scope 3
Upstream Emissions


0.075 t CO2e
Scope 1.4 Direct Emissions from specific production processes (relevant only for a few industries)
Source: BWA
Tentative

- kg CO2e
Scope 1.3 Direct Emissions of volatile gases, leaks, and faulty pipes from the use of air conditioning systems
Source: BWA
Very precise


5.37 t CO2e
Scope 3.1 Emissions from purchased goods and services (raw material extraction, production, and transport)
Source: BWA
Preliminary

Edit

2,906.20 t CO2e

5.67 t CO2e
Scope 1.2 Direct Emissions from fuel consumption of owned vehicles (leasing and ownership)
Source: BWA
Precise

Edit


This category cannot be edited
Very accurate

Scope 2
Indirect emissions from purchased energy
4,000.20 t CO2e


Preliminary
Scope 2.1 Indirect emissions from purchased electricity
Source: BWA
Preliminary
5.37 t CO2e
Scope 2.2 Indirect emissions from district heating/cooling
Source: BWA
Accurate
5.67 t CO2e
Scope 2.3 Indirect emissions from purchased steam
Source: BWA
Very accurate
1.37 t CO2e

S. Jones
Weber Logistik

Scope 3
Nachgelagerte Emissionen
-- t CO2e
Bald verfügbar!
Calculation
CO2 Balance
Results History

Result

Extracted Data
Upload BWA
Recent calculations
Trend

Scope 3
Downstream emissions
0.075 t CO2e
Scope 1.4 Direct emissions from specific production processes (relevant only for a few industries)
Source: BWA
Tentative
- kg CO2e
Scope 1.3 Direct emissions of volatile gases, leaks, and faulty pipes from the use of air conditioning systems
Source: BWA
Very precise

2,906.20 t CO2e
5.67 t CO2e
Source: BWA
Precise

Edit
This category cannot be edited
Scope 3.8 Emissions from the transport and distribution of goods or services between the company...
Source: BWA
Preliminary
5.37 t CO2e
Scope 3.9 Emissions from the transport and distribution of goods or services between the company...
Source: BWA
Accurate
5.67 t CO2e
Results Screen 1
Your CO2 balance
Calculated with bwa_example.pdf



Download CO2 balance


Scope 1
Direct emissions

4,000.20 t CO2e
Exact

Scope 1.1 Direct emissions from combustion processes of stationary plants (heating oil, natural gas)
Source: BWA
Preliminary
5.37 t CO2e
Scope 1.2 Direct emissions from fuel consumption of owned vehicles (leasing and ownership)
Source: BWA
Accurate
5.67 t CO2e
Scope 1.3 Direct emissions from volatile gases, leaks, and faulty piping when using air conditioning systems
Source: BWA
Very accurate
-- kg CO2e
Scope 1.4 Direct emissions from specific production processes (relevant for only a few industries)
Source: BWA
Preliminary
0.075 t CO2e


Scope 3
Upstream Emissions


0.075 t CO2e
Scope 1.4 Direct Emissions from specific production processes (relevant only for a few industries)
Source: BWA
Tentative

- kg CO2e
Scope 1.3 Direct Emissions of volatile gases, leaks, and faulty pipes from the use of air conditioning systems
Source: BWA
Very precise


5.37 t CO2e
Scope 3.1 Emissions from purchased goods and services (raw material extraction, production, and transport)
Source: BWA
Preliminary

Edit

2,906.20 t CO2e

5.67 t CO2e
Scope 1.2 Direct Emissions from fuel consumption of owned vehicles (leasing and ownership)
Source: BWA
Precise

Edit


This category cannot be edited
Very accurate

Scope 2
Indirect emissions from purchased energy
4,000.20 t CO2e


Preliminary
Scope 2.1 Indirect emissions from purchased electricity
Source: BWA
Preliminary
5.37 t CO2e
Scope 2.2 Indirect emissions from district heating/cooling
Source: BWA
Accurate
5.67 t CO2e
Scope 2.3 Indirect emissions from purchased steam
Source: BWA
Very accurate
1.37 t CO2e

S. Jones
Weber Logistik

Scope 3
Nachgelagerte Emissionen
-- t CO2e
Bald verfügbar!
Calculation
CO2 Balance
Results History

Result

Extracted Data
Upload BWA
Recent calculations
Trend

Scope 3
Downstream emissions
0.075 t CO2e
Scope 1.4 Direct emissions from specific production processes (relevant only for a few industries)
Source: BWA
Tentative
- kg CO2e
Scope 1.3 Direct emissions of volatile gases, leaks, and faulty pipes from the use of air conditioning systems
Source: BWA
Very precise

2,906.20 t CO2e
5.67 t CO2e
Source: BWA
Precise
Edit
This category cannot be edited
Scope 3.8 Emissions from the transport and distribution of goods or services between the company...
Source: BWA
Preliminary
5.37 t CO2e
Scope 3.9 Emissions from the transport and distribution of goods or services between the company...
Source: BWA
Accurate
5.67 t CO2e

Result
Industry
average
Your result





3,056.20 t CO2e


30%
4,000.20 t CO2e
1,300.20 t CO2e
50%
6,213.20 t CO2e
950.20 t CO2e

895 t CO2e
50%
20%
55%
45%
CO2 emissions

per employee

per €100,000 revenue


Scope 1


Scope 2


Scope 3


would need to be planted to offset your CO2 footprint
Results Screen 2
save
trash
save
trash
save
trash
Extracted Data
Step 2 of 2

Calculation
CO2 Balance
Upload BWA

Extracted Data
Result
Result History
Company Profile
eye

S. Jones
Weber Logistics
Vehicle Costs
i

4,500
£
Gas

3,000
£
Electricity
i
Oil


6,000
£
Business Trips
i

1,500
£

4240
Electricity, Water (x%)
2,000
£
3987
Position Text (x%)
6,000
£

4240
Gas, Electricity, Water (x%)
1,500
£
3987
Position Text (x%)
Vehicle Costs
i

4,500
£
4,500
£
3987
Position Text (x%)
1,500
£

4923
Energy Sources (x%)
500
£
9294
Heating Oil (x%)


To CO2 Balance

Back
January
April
July
October
February
May
August
November
March
June
September
December

2022


-
October 2022


Save
Reset
Period
Extracted Data - Reporting Period Selection
Upload & evaluate BWA
Step 1 of 2

S. Jones
Weber Logistics

Extract evaluation for bwa_example.pdf.
Approximately 1 minute remaining


76%
Result is being generated…

Select already uploaded file
Select file
Select file
Calculation
CO2 balance
Upload BWA
Result history
Upload BWA Screen 2

Upload & analyse BWA
Step 1 of 2
S. Jones
Weber Logistics
Select already uploaded file
Select file

Analysis for bwa_example.pdf.
Your BWA has been analysed


100%

Result

Back
Select file
Calculation
CO2 balance
Upload BWA
Result history
Upload BWA Screen 3








Learn more


Contact

Don't have any login credentials?
Contact us!
Forgot your password?

Email address

Password
eye
Login
Login
After logging in, you will be redirected to your bank's or license provider's subpage. They are the publishers of the respective subpage and are responsible for the content.
Back
Login Screen








Learn more


Contact
Back


My company is a customer of
Contact

First & Last Name

Company

Email Address

Bank
Please select

I agree that the selected bank (if not specified, then Volksbank Digital Solutions GmbH) may use my provided data to send me an email with my access details for gecco2.

Detailed analyses
Receive detailed
information and comparisons on
Scope 1 and Scope 2 emissions
of your company.
Coming soon: Scope 3


Send
Contact Screen
SCREENS
After rounds of user testing and stakeholder review, I received valuable feedback for improving both the Trend chart, the results screen, the Upload BWA screen, and some minor changes to the other screens as well:
Trend

S. Jones
Weber Logistics

Calculation
CO2 Balance
Upload BWA
Result History

Trend


0.005
0.004
0.003
0.002
0.001
0.000
1 Month
6 Months
1 Year
5 Years
10 Years
2020
2022
2023

2019
2021

1 CO2e
Time





0.003
Feb, 2021


CO2 Balance Period
CO2 Balance Month

SECOND DESIGN ITERATION -POST USER TESTING

Trend

S. Jones
Weber Logistics

Calculation
CO2 Balance
Upload BWA
Result History

Trend


0.005
0.004
0.003
0.002
0.001
0.000
0.005
0.004
0.003
0.002
0.001
0.000
6 Months
1 Year
5 Years
10 Years
2020
2022
2023

2019
2021

Monthly CO2e (t)
Period/Year CO2e (t)
Time





Month

Period/Year

Period/Year (Jan 2024 - Sep 2024): 123.23 t

Month (Jan 2021): 0.0030 t
Your CO2 balance
Calculated with bwa_example.pdf


Download CO2 balance


Scope 1
Direct emissions

4,000.20 t CO2e
Exact

Scope 1.1 Direct emissions from combustion processes of stationary plants (heating oil, natural gas)
Source: BWA
Preliminary
5.37 t CO2e

Edit
Scope 1.2 Direct emissions from fuel consumption of owned vehicles (leasing and ownership)
Source: BWA
Accurate
5.67 t CO2e

Edit

Scope 1.3 Direct emissions from volatile gases, leaks, and faulty piping when using air conditioning systems
Source: BWA
Very accurate
-- kg CO2e
Scope 1.4 Direct emissions from specific production processes (relevant for only a few industries)
Source: BWA
Preliminary
0.075 t CO2e


Scope 3
Upstream Emissions


0.075 t CO2e
Scope 1.4 Direct Emissions from specific production processes (relevant only for a few industries)
Source: BWA
Tentative

- kg CO2e
Scope 1.3 Direct Emissions of volatile gases, leaks, and faulty pipes from the use of air conditioning systems
Source: BWA
Very precise


5.37 t CO2e
Scope 3.1 Emissions from purchased goods and services (raw material extraction, production, and transport)
Source: BWA
Preliminary

Edit

2,906.20 t CO2e

5.67 t CO2e
Scope 1.2 Direct Emissions from fuel consumption of owned vehicles (leasing and ownership)
Source: BWA
Precise

Edit


This category cannot be edited
Very accurate

Scope 2
Indirect emissions from purchased energy
4,000.20 t CO2e


Preliminary
Scope 2.1 Indirect emissions from purchased electricity
Source: BWA
Preliminary
5.37 t CO2e

Edit
Scope 2.2 Indirect emissions from district heating/cooling
Source: BWA
Accurate
5.67 t CO2e

Edit
Scope 2.3 Indirect emissions from purchased steam
Source: BWA
Very accurate
1.37 t CO2e

S. Jones
Weber Logistik
Calculation
CO2 Balance
Results History

Result

Extracted Data
Upload BWA
Recent calculations
Trend

Scope 3
Downstream emissions
0.075 t CO2e
Scope 1.4 Direct emissions from specific production processes (relevant only for a few industries)
Source: BWA
Tentative
- kg CO2e
Scope 1.3 Direct emissions of volatile gases, leaks, and faulty pipes from the use of air conditioning systems
Source: BWA
Very precise

2,906.20 t CO2e
5.67 t CO2e
Source: BWA
Precise

Edit
This category cannot be edited
Scope 3.8 Emissions from the transport and distribution of goods or services between the company...
Source: BWA
Preliminary
5.37 t CO2e

Edit
Scope 3.9 Emissions from the transport and distribution of goods or services between the company...
Source: BWA
Accurate
5.67 t CO2e
Scope 2.1 Indirect emissions from purchased electricity
Source: BWA
Preliminary
5.37 t CO2e

Edit

Result
Industry
average
Your result


3,056.20 t CO2e


30%
4,000.20 t CO2e
1,300.20 t CO2e
50%
6,213.20 t CO2e
950.20 t CO2e

895 t CO2e
50%
20%
55%
45%
CO2 emissions

per employee

per €100,000 revenue


Scope 1


Scope 2


Scope 3


would need to be planted to offset your CO2 footprint
Your CO2 balance
Calculated with bwa_example.pdf


Download CO2 balance


Scope 1
Direct emissions

4,000.20 t CO2e
Exact

Scope 1.1 Direct emissions from combustion processes of stationary plants (heating oil, natural gas)
Source: BWA
Preliminary
5.37 t CO2e
Scope 1.2 Direct emissions from fuel consumption of owned vehicles (leasing and ownership)
Source: BWA
Accurate
5.67 t CO2e
Scope 1.3 Direct emissions from volatile gases, leaks, and faulty piping when using air conditioning systems
Source: BWA
Very accurate
-- kg CO2e
Scope 1.4 Direct emissions from specific production processes (relevant for only a few industries)
Source: BWA
Preliminary
0.075 t CO2e


Scope 3
Upstream Emissions


0.075 t CO2e
Scope 1.4 Direct Emissions from specific production processes (relevant only for a few industries)
Source: BWA
Tentative

- kg CO2e
Scope 1.3 Direct Emissions of volatile gases, leaks, and faulty pipes from the use of air conditioning systems
Source: BWA
Very precise


5.37 t CO2e
Scope 3.1 Emissions from purchased goods and services (raw material extraction, production, and transport)
Source: BWA
Preliminary

Edit

2,906.20 t CO2e

5.67 t CO2e
Scope 1.2 Direct Emissions from fuel consumption of owned vehicles (leasing and ownership)
Source: BWA
Precise

Edit


This category cannot be edited
Very accurate

Scope 2
Indirect emissions from purchased energy
4,000.20 t CO2e


Preliminary
Scope 2.1 Indirect emissions from purchased electricity
Source: BWA
Preliminary
5.37 t CO2e
Scope 2.2 Indirect emissions from district heating/cooling
Source: BWA
Accurate
5.67 t CO2e
Scope 2.3 Indirect emissions from purchased steam
Source: BWA
Very accurate
1.37 t CO2e

S. Jones
Weber Logistik

Scope 3
Nachgelagerte Emissionen
-- t CO2e
Bald verfügbar!

Calculation
CO2 Balance
Results History

Result

Extracted Data
Upload BWA
Recent calculations
Trend

Scope 3
Downstream emissions
0.075 t CO2e
Scope 1.4 Direct emissions from specific production processes (relevant only for a few industries)
Source: BWA
Tentative
- kg CO2e
Scope 1.3 Direct emissions of volatile gases, leaks, and faulty pipes from the use of air conditioning systems
Source: BWA
Very precise

2,906.20 t CO2e
5.67 t CO2e
Source: BWA
Precise

Edit
This category cannot be edited
Scope 3.8 Emissions from the transport and distribution of goods or services between the company...
Source: BWA
Preliminary
5.37 t CO2e
Scope 3.9 Emissions from the transport and distribution of goods or services between the company...
Source: BWA
Accurate
5.67 t CO2e

Result
Industry
average
Your result


3,056.20 t CO2e


30%
4,000.20 t CO2e
1,300.20 t CO2e
50%
6,213.20 t CO2e
950.20 t CO2e

895 t CO2e
50%
20%
55%
45%
CO2 emissions

per employee

per €100,000 revenue


Scope 1


Scope 2


Scope 3


would need to be planted to offset your CO2 footprint
On the updated Trends chart, the data points and tooltip now clearly display both the total CO₂
emissions for a selected period or year (e.g., Jan 2024–Sep 2024: 123.23 t) and the specific
value for a chosen month (e.g., Jan 2021: 0.0030 t).
The updated Results Screen now includes “EDIT” buttons, allowing users to manually adjust
Scope 1, 2, and 3 emissions directly to ensure more accurate CO₂ reporting.
Users can now manually enter and adjust their company’s data for Scope 1, 2, 3 emissions , allowing for more accurate and tailored CO₂ reporting.
As part of the second iteration, I improved the Extracted Data page by refining the alignment, grouping related items into clear collapsible sections,
and enhancing the overall layout—making it easier for users to review and enter their data accurately and efficiently.
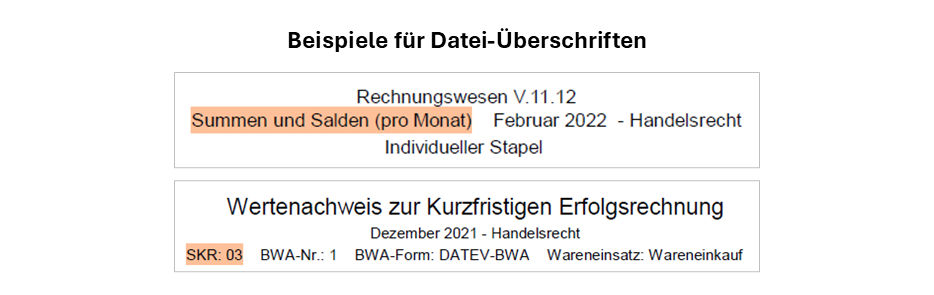
For the BWA Upload screen, users needed clear examples of what type of BWA statement was required, so I added a carousel of real sample documents provided by Volksbank.
I also included a notification bar at the top for important information and translated all screens into German as requested.
Ihre CO2-Bilanz
Berechnet mit bwa_beispiel.pdf

Berechnung
CO2-Bilanz

Upload BWA
Ergebnishistorie


CO2-Bilanz herunterladen

CO2e
für März 2021
11.155,68 t
4.000,20 t
4.000,20 t
2.906,20 t

Scope 1

Scope 2

Scope 3


Auswirkungen


Details


Scope 1
Direkte Emissionen


0,075 t CO2e
Scope 1.4 Direkte Emissionen aus besonderen Produktionsprozessen (nur für wenige Branchen relevant)
Quelle: BWA
Vorläufig

-- kg CO2e
Scope 1.3 Direkte Emissionen flüchtiger Gase, Leckagen und undichte Leitungen durch den Einsatz von Klimaanlagen
Quelle: BWA


5,37 t CO2e
Scope 1.1 Direkte Emissionen aus Verbrennungsprozessen stationärer Anlagen (Heizöl, Erdgas)
Quelle: BWA
Vorläufig

4.000,20 t CO2e

5,67 t CO2e
Scope 1.2 Direkte Emissionen durch Kraftstoffverbrauch selbstgenutzter Fahrzeuge (Leasing und Eigentum)
Quelle: BWA
Präzise

Bearbeiten


Diese Kategorie ist nicht editierbar.

Bearbeiten
Sehr präzise


Scope 3
Vorgelagerte Emissionen


0,075 t CO2e
Scope 1.4 Direkte Emissionen aus besonderen Produktionsprozessen (nur für wenige Branchen relevant)
Quelle: BWA
Tentavive

- kg CO2e
Scope 1.3 Direkte Emissionen flüchtiger Gase, Leckagen und undichte Leitungen durch den Einsatz von Klimaanlagen
Quelle: BWA
Very precise


5,37 t CO2e
Scope 3.1 Emissionen der eingekauften Waren und Dienstleistungen (Rohstoffgewinnung, Produktion und Transport)
Quelle: BWA
Vorläufig

Edit

2.906,20 t CO2e

5,67 t CO2e
Scope 1.2 Direkte Emissionen durch Kraftstoffverbrauch selbstgenutzter Fahrzeuge (Leasing und Eigentum)
Quelle: BWA
Precise

Edit


This category is not
possible to edit


Scope 2
Indirekte Emissionen durch bezogene Energien
4.000,20 t CO2e


1,37 t CO2e
Scope 2.3 Indirekte Emissionen aus gekauftem Dampf
Quelle: BWA
Sehr präzise


5,37 t CO2e
Scope 2.1 Indirekte Emissionen aus gekauftem Strom
Quelle: BWA
Vorläufig

5,67 t CO2e
Scope 2.2 Indirekte Emissionen aus Fernwärme/-kälte
Quelle: BWA
Präzise

Bearbeiten
Bearbeiten

“Bitte beachten Sie: Aktuell ist keine Berechnung der
Emissionen für die Verbrennung von Holzelementen möglich.”

S. Jones
Weber Logistik

Scope 3
Nachgelagerte Emissionen
-- t CO2e
Bald verfügbar!


Direct emissions from combustion processes of stationary facilities (heating oil, natural gas)
Scope 1.1
Period: January 2022
To improve the accuracy of your calculation, choose one of the following options:

Please provide your company's natural gas costs and/or heating oil costs for the specified period:

-
Oil costs
€
-
€
Gas costs
If you fill in this data, your result will be accurate

Please provide your company's natural gas consumption and/or heating oil consumption for the specified period:
If you fill in this data, your result will be very accurate
Gas consumption

1,000
kWh
I
-
Oil consumption
Back to overview
Save
Preliminary
Ihre CO2-Bilanz
Berechnet mit bwa_beispiel.pdf

Berechnung
CO2-Bilanz
Upload BWA
Ergebnishistorie
CO2-Bilanz herunterladen

CO2e
für März 2021
11.155,68 t
4.000,20 t
4.000,20 t
2.906,20 t
Scope 1
Scope 2
Scope 3

Auswirkungen


Details

Scope 1
Direkte Emissionen
0,075 t CO2e
Scope 1.4 Direkte Emissionen aus besonderen Produktionsprozessen (nur für wenige Branchen relevant)
Quelle: BWA
Vorläufig
-- kg CO2e
Scope 1.3 Direkte Emissionen flüchtiger Gase, Leckagen und undichte Leitungen durch den Einsatz von Klimaanlagen
Quelle: BWA

5,37 t CO2e
Scope 1.1 Direkte Emissionen aus Verbrennungsprozessen stationärer Anlagen (Heizöl, Erdgas)
Quelle: BWA
Vorläufig
4.000,20 t CO2e
5,67 t CO2e
Scope 1.2 Direkte Emissionen durch Kraftstoffverbrauch selbstgenutzter Fahrzeuge (Leasing und Eigentum)
Quelle: BWA
Präzise

Bearbeiten

Diese Kategorie ist nicht editierbar.
Bearbeiten
Sehr präzise

Scope 3
Vorgelagerte Emissionen
0,075 t CO2e
Scope 1.4 Direkte Emissionen aus besonderen Produktionsprozessen (nur für wenige Branchen relevant)
Quelle: BWA
Tentavive
- kg CO2e
Scope 1.3 Direkte Emissionen flüchtiger Gase, Leckagen und undichte Leitungen durch den Einsatz von Klimaanlagen
Quelle: BWA
Very precise

5,37 t CO2e
Scope 3.1 Emissionen der eingekauften Waren und Dienstleistungen (Rohstoffgewinnung, Produktion und Transport)
Quelle: BWA
Vorläufig
Edit

2.906,20 t CO2e
5,67 t CO2e
Scope 1.2 Direkte Emissionen durch Kraftstoffverbrauch selbstgenutzter Fahrzeuge (Leasing und Eigentum)
Quelle: BWA
Precise

Edit
This category is not
possible to edit
Scope 2
Indirekte Emissionen durch bezogene Energien
4.000,20 t CO2e

1,37 t CO2e
Scope 2.3 Indirekte Emissionen aus gekauftem Dampf
Quelle: BWA
Sehr präzise

5,37 t CO2e
Scope 2.1 Indirekte Emissionen aus gekauftem Strom
Quelle: BWA
Vorläufig

5,67 t CO2e
Scope 2.2 Indirekte Emissionen aus Fernwärme/-kälte
Quelle: BWA
Präzise

Bearbeiten
Bearbeiten
“Bitte beachten Sie: Aktuell ist keine Berechnung der
Emissionen für die Verbrennung von Holzelementen möglich.”
S. Jones
Weber Logistik
Scope 3
Nachgelagerte Emissionen
-- t CO2e
Bald verfügbar!
Direct emissions from combustion processes of stationary installations (heating oil, natural gas)
Scope 1.1
To improve the accuracy of your calculation, choose one of the following options:

Please provide your company's natural gas costs and/or heating oil costs for the specified period:
-
Gas costs
€
-
€
Oil costs
If you fill in this data, your result will be accurate

Please provide your company's natural gas consumption and/or heating oil consumption for the specified period:
If you fill in this data, your result will be very accurate
Gas consumption
-
kWh

I
-
Oil consumption
Back to overview
Save
Preliminary
Ihre CO2-Bilanz
Berechnet mit bwa_beispiel.pdf

Berechnung
CO2-Bilanz

Upload BWA
Ergebnishistorie

CO2-Bilanz herunterladen

CO2e
für März 2021
11.155,68 t
4.000,20 t
4.000,20 t
2.906,20 t

Scope 1

Scope 2

Scope 3


Auswirkungen


Details


Scope 1
Direkte Emissionen


0,075 t CO2e
Scope 1.4 Direkte Emissionen aus besonderen Produktionsprozessen (nur für wenige Branchen relevant)
Quelle: BWA
Vorläufig

-- kg CO2e
Scope 1.3 Direkte Emissionen flüchtiger Gase, Leckagen und undichte Leitungen durch den Einsatz von Klimaanlagen
Quelle: BWA


5,37 t CO2e
Scope 1.1 Direkte Emissionen aus Verbrennungsprozessen stationärer Anlagen (Heizöl, Erdgas)
Quelle: BWA
Vorläufig

4.000,20 t CO2e

5,67 t CO2e
Scope 1.2 Direkte Emissionen durch Kraftstoffverbrauch selbstgenutzter Fahrzeuge (Leasing und Eigentum)
Quelle: BWA
Präzise

Bearbeiten


Diese Kategorie ist nicht editierbar.

Bearbeiten
Sehr präzise


Scope 3
Vorgelagerte Emissionen


0,075 t CO2e
Scope 1.4 Direkte Emissionen aus besonderen Produktionsprozessen (nur für wenige Branchen relevant)
Quelle: BWA
Tentavive

- kg CO2e
Scope 1.3 Direkte Emissionen flüchtiger Gase, Leckagen und undichte Leitungen durch den Einsatz von Klimaanlagen
Quelle: BWA
Very precise


5,37 t CO2e
Scope 3.1 Emissionen der eingekauften Waren und Dienstleistungen (Rohstoffgewinnung, Produktion und Transport)
Quelle: BWA
Vorläufig

Edit

2.906,20 t CO2e

5,67 t CO2e
Scope 1.2 Direkte Emissionen durch Kraftstoffverbrauch selbstgenutzter Fahrzeuge (Leasing und Eigentum)
Quelle: BWA
Precise

Edit


This category is not
possible to edit


Scope 2
Indirekte Emissionen durch bezogene Energien
4.000,20 t CO2e


1,37 t CO2e
Scope 2.3 Indirekte Emissionen aus gekauftem Dampf
Quelle: BWA
Sehr präzise


5,37 t CO2e
Scope 2.1 Indirekte Emissionen aus gekauftem Strom
Quelle: BWA
Vorläufig

5,67 t CO2e
Scope 2.2 Indirekte Emissionen aus Fernwärme/-kälte
Quelle: BWA
Präzise

Bearbeiten
Bearbeiten

“Bitte beachten Sie: Aktuell ist keine Berechnung der
Emissionen für die Verbrennung von Holzelementen möglich.”

S. Jones
Weber Logistik

Scope 3
Nachgelagerte Emissionen
-- t CO2e
Bald verfügbar!


Direct emissions from volatile gases, leaks, and faulty pipes when using air conditioning systems
Scope 1.3
Period: January 2022
To improve the accuracy of your calculation, choose one of the following options:

Please specify the total area cooled by air conditioning in your company.

-
Total area
sqm
If you fill in this data, your result will be very accurate

Please specify the total output of the air conditioning systems in your company for the selected period.
If you fill in this data, your result will be very accurate
Air conditioning systems
-
kWh
Back to overview
Save
Preliminary
Ihre CO2-Bilanz
Berechnet mit bwa_beispiel.pdf

Berechnung
CO2-Bilanz
Upload BWA
Ergebnishistorie
CO2-Bilanz herunterladen

CO2e
für März 2021
11.155,68 t
4.000,20 t
4.000,20 t
2.906,20 t
Scope 1
Scope 2
Scope 3

Auswirkungen


Details

Scope 1
Direkte Emissionen
0,075 t CO2e
Scope 1.4 Direkte Emissionen aus besonderen Produktionsprozessen (nur für wenige Branchen relevant)
Quelle: BWA
Vorläufig
-- kg CO2e
Scope 1.3 Direkte Emissionen flüchtiger Gase, Leckagen und undichte Leitungen durch den Einsatz von Klimaanlagen
Quelle: BWA

5,37 t CO2e
Scope 1.1 Direkte Emissionen aus Verbrennungsprozessen stationärer Anlagen (Heizöl, Erdgas)
Quelle: BWA
Vorläufig

4.000,20 t CO2e
5,67 t CO2e
Scope 1.2 Direkte Emissionen durch Kraftstoffverbrauch selbstgenutzter Fahrzeuge (Leasing und Eigentum)
Quelle: BWA
Präzise

Bearbeiten
Diese Kategorie ist nicht editierbar.
Bearbeiten
Sehr präzise

Scope 3
Vorgelagerte Emissionen
0,075 t CO2e
Scope 1.4 Direkte Emissionen aus besonderen Produktionsprozessen (nur für wenige Branchen relevant)
Quelle: BWA
Tentavive
- kg CO2e
Scope 1.3 Direkte Emissionen flüchtiger Gase, Leckagen und undichte Leitungen durch den Einsatz von Klimaanlagen
Quelle: BWA
Very precise

5,37 t CO2e
Scope 3.1 Emissionen der eingekauften Waren und Dienstleistungen (Rohstoffgewinnung, Produktion und Transport)
Quelle: BWA
Vorläufig

Edit

2.906,20 t CO2e
5,67 t CO2e
Scope 1.2 Direkte Emissionen durch Kraftstoffverbrauch selbstgenutzter Fahrzeuge (Leasing und Eigentum)
Quelle: BWA
Precise

Edit
This category is not
possible to edit
Scope 2
Indirekte Emissionen durch bezogene Energien
4.000,20 t CO2e

1,37 t CO2e
Scope 2.3 Indirekte Emissionen aus gekauftem Dampf
Quelle: BWA
Sehr präzise

5,37 t CO2e
Scope 2.1 Indirekte Emissionen aus gekauftem Strom
Quelle: BWA
Vorläufig

5,67 t CO2e
Scope 2.2 Indirekte Emissionen aus Fernwärme/-kälte
Quelle: BWA
Präzise

Bearbeiten
Bearbeiten
“Bitte beachten Sie: Aktuell ist keine Berechnung der
Emissionen für die Verbrennung von Holzelementen möglich.”
S. Jones
Weber Logistik
Scope 3
Nachgelagerte Emissionen
-- t CO2e
Bald verfügbar!


Direct emissions from fuel consumption of self-used vehicles (leasing and ownership)
Scope 1.2
Period: January 2022
To improve the accuracy of your calculation, please select one of the following options:

Please specify the total litres of diesel/petrol consumed during the selected period by all vehicles used by your company (leasing or ownership).

-
Diesel
l
-
l
Petrol
If you fill in this data, your result will be very accurate

Estimate the total kilometres driven during the selected period by all vehicles used by your company (leasing or ownership).
If you fill in this data, your result will be accurate
Kilometres driven
-
km
Please specify the total kilometres driven during the selected period by all vehicles used by your company (leasing or ownership).
If you fill in this data, your result will be very accurate
Kilometres driven
-
km
Back to overview
Save
Accurate
-
October 2022


Extracted Data
Step 2 of 2

Calculation
CO2 Balance

Extracted Data
Result History
Company Profile
eye

S. Jones
Weber Logistics
Gas

3,000
£
Electricity
Oil


Business Trips


4,240
Electricity, Water (x%)
2,000
£
3,987
Position Text (x%)
6,000
£

4,240
Gas, Electricity, Water (x%)
1,500
£

3,987
Position Text (x%)
Vehicle Costs
4,500
£

3,987
Position Text (x%)
1,500
£

4,923
Energy Sources (x%)
500
£
9,294
Heating Oil (x%)


To CO2 Balance

Back
save
trash
save
trash
save
trash
save
trash
save
trash
save
trash
save
trash


Extracted Data
Step 2 of 2

Calculation
CO2 Balance

Extracted Data
Result History

S. Jones
Weber Logistics
Company Profile
eye
Gas
(5,000 €)


4240
Gas, Electricity, Water (x%)
3,000
€
trash
save
3987
Position Text (x%)
2,000
€
trash
save
Oil
(2,000 €)

4923
Energy Materials (x%)
1,500
€
trash
save
9294
Heating Oil (x%)
500
€
trash
save
Electricity
(6,000 €)

4240
Gas, Electricity, Water (x%)
6,000
€
trash
save

To the CO2 Balance

Back
Upload & evaluate BWA
Step 1 of 2

S. Jones
Weber Logistics


Drag & drop your BWA here
or use the “Select File” button.
Please use a .pdf format.


Select previously uploaded file

Select file

Select file
Calculation
CO2 balance

Upload BWA
Result history
BWA hochladen & berechnen
Schritt 1 von 2

Berechnung
CO2-Bilanz
Upload BWA
Ergebnishistorie

S. Jones
Weber Logistik

Sie nutzen aktuell gecco₂ Pro. Damit können Sie für 12 Monate unbegrenzt viele Detail-Berechnungen Ihres CO₂-Abdrucks durchführen.

Aktuell werden nur .pdf Formate unterstützt
BWA hier reinziehen
oder
Datei auswählen
Anzahl verfügbarer Basic-Berechnungen: 1

Zurück

Berechnung starten
Anforderungen an Ihre BWA:
1
Nutzen Sie für den Upload eine BWA mit Summen- und Saldenliste, z.B. von DATEV, Addison oder Lexware.
Die Verwendung der Standardkontenrahmen SK03 oder SK04 erleichtert zudem das Auslesen der Datei.


Gecco2 is a digital sustainability assistant that enables small- and medium-sized enterprises (SMEs) to quickly calculate, analyze, and monitor their CO₂ emissions using their existing financial documents (BWA). This project was launched in collaboration with VolksbankPur and later extended to Sparkasse (ProEco), providing their SME clients with a simple, certified tool to support their sustainability journey and regulatory requirements.
I started out with a series of interviews with Volksbank Pur staff to understand firsthand their clients’ pain points and expectations regarding CO₂ reporting. I then documented key responses from these interviews, along with insights from additional research, and categorized them into clear feature priorities:
After conducting the stakeholder interviews and synthesizing the key insights, I started out by creating a user journey map to visualize each stage of the User’s experience with Gecco2 —from initial contact by the bank, through registration and BWA document upload, to receiving and sharing their CO₂ report. This helped me identify key pain points, emotional highs and lows, and opportunities for improving clarity and ease-of-use across the entire customer journey.
Here, I focused on illustrating the exact journey a user would follow within Gecco2 and ProEcco— from landing on the platform, registering, uploading their BWA, and reviewing extracted data, to downloading their certified CO₂ report. This allowed me to pinpoint where users might need extra guidance, and refine the flow so even non-technical business clients could complete the process smoothly and with confidence, all in just a few intuitive steps.
After defining the user flow, I structured the information architecture to group related tasks together and keep the interface intuitive. Here, I defined clear modules for CO₂ calculation, result history, data trends, optimizations, and account settings—making sure every function was logically placed and that users could always find what they needed with minimal clicks.

End user’s journey map
Project brief
Analyse &
Synthesise
Define
opportunities
Research to
understand
the problem
& users


Research
Analyse

End user
actions
Service
Phase
Tasks
Thoughts& emotions
Recommend-ations
- Filling personal info.
- Checking email
- Clicking a link
- Check the result
- Filling missing parts
- It is hussle that I have to compare BWA with the system
- It says it is inaccurate and my rate is quite low. I don’t think i can use it.
- I have to fill in all again. Why did I need to upload BWA?
- I can not go back
- The result looks good finally
- can I just send it over directly?
- Giving two options: A: BWA / B: Input filed with info. Benefit of using BWA
Banefit of inputting
- Option to open BWA you just uploaded
- Feature for direct sending over
- Inputting data manually
(amount of usage)
- Clicking next
- Check the data
- Donloading the result
- Open my folder
- Open my email & send
- Click to upload
- Waiting until it is complete
VB company
consultant
Receiving
Link
Sales:
email, phone calls
Registration
Upload BWA
Showing
the result
Clink to improve the accuracy
Showing the result
Sending it over




Before
Begining
During
After
🙂
🙂
🙂
🤯
🤔
🤔
😊

Project brief
Analyse &
Synthesise
Define
opportunities
Research to
understand
the problem
& users


Research
Analyse
Landing page
Start / End
Home screen
Upload &
calculate BWA
Manual review
Screen
Choose a file
or
Select a file
Show the result
or
Return
Upload
Show the result
Select
Return
- Payment pop-up
- Company profle
- Filling information
- Waiting
- Waiting

Registration
Calculate
your co2
Start
calculation
Save on
computer
Decision

Action


Result page
pop-ups
Download
or
Improve
Download
Improve
Scope 1
Scope 2


Business clients of Volksbank Pur and Sparkasse (especially SMEs) needed an intuitive, trustworthy way to assess and track their company’s CO₂ footprint, especially with evolving ESG reporting standards and increasing pressure from partners, clients, and regulators. Traditional CO₂ calculators were either too complex, manual, or inaccurate for the average business owner or finance manager.
1. Project Overview
2. The Challenge
- UNDERSTANDING THE USER
- DISCOVERY & INSIGHT GENERATION
- GETTING TO WORK
THE PROBLEM
TARGET AUDIENCE
CUSTOMER JOURNEY MAPPING
CUSTOMER USER FLOW
INFORMATION ARCHITECTURE
USER & STAKEHOLDER INTERVIEWS
BUSINESS GOALS

Provide an easy-to-use, self-service platform for Volksbank Pur and Sparkasse clients to generate certified CO₂ reports from their standard financial documents.
Position Volksbank Pur and Sparkasse as digital innovators by integrating sustainability into their value-added services.
Help businesses comply with ESG and supply chain reporting requirements without needing additional external consulting.
Business owners, accountants, and finance managers of small and medium-sized enterprises who are customers of Volksbank Pur or Sparkasse.
Typically non-specialists in climate or sustainability topics, focused on practical business outcomes.

Project brief
Analyse &
Synthesise
Define
opportunities
Research to
understand
the problem
& users


Research
Analyse
Landing page
contact VDS
Log in
Start Caculate Co2
Profile / Name
Upload BWA
Password change
picture and name change
Choose picture
Password setting pop ups
Change plan
pop ups
Quitting Subscription
pop ups
company profile change
pop ups
Payment change
pop ups
Subscription change
Quitting Subscription
Company profile
List of receipts
download
contact detail
Search
FAQ
Payment
Calcurate co2 emission
Extracted data
Calculation result
Result / improvement
Extracted data analysis
Result analysis

Improvement pop-ups
Last calculations
Result history
Setting
Rechnungen
Support
Trend
- Moved from setting
- Inactive
- Deleted





After finalizing the information architecture and sketching wireframes to define the skeletal structure of the platform, I began designing the core entry screens: the landing page, contact, and login screens. On the header navigation, users can immediately access “Contact” and “Login” for support or account access. The hero section includes a brief description of the platform’s benefits and a “Calculate CO₂ footprint” button that serves as the main entry point into the calculation workflow:
Once the user clicks the "Calculate CO₂ footprint" button, the user is redirected to the Upload BWA Screen where they can submit their BWA financial statement as a PDF. This document is then used to extract relevant financial data and automatically calculate the company's CO₂ emissions:
On the Trend Screen, users can see and compare their company’s CO₂ balance across different time periods—like 1 month, 6 months, 1 year, 5 years, or 10 years by switching though the tabs on top of the chart. The graph displays two lines: the orange line tracks your monthly CO₂ balance, while the green line shows the average over a selected period:
After the user uploads their BWA financial statement, they are taken to the next screen where all relevant data automatically extracted from the BWA document is clearly displayed. Data for categories such as Gas, Electricity, Oil, and others are pre-filled, and the user can also select the reporting period directly from the calendar:
After verifying and adjusting their extracted data, the user arrives at the results screen. On the results screen, users see their total CO₂ balance clearly divided into Scopes 1, 2, and 3. Each section provides a breakdown of emission sources and indicates the accuracy or status of the data. Users can compare their results against industry benchmarks and instantly download a comprehensive CO₂ report:








1
4
7
0
2
5
8
3
6
9
*
=
+
-
%

0.00


Learn more

The smart sustainability assistant for your business
The fastest current analysis for climate protection: From the financial statement to the carbon footprint in just a few minutes. Start your calculation now.
Login
Contact
Calculate CO2 footprint
Landing Page
Upload & evaluate BWA
Step 1 of 2

S. Jones
Weber Logistics


Drag & drop your BWA here
or use the “Select File” button.
Please use a .pdf format.


Select previously uploaded file

Select file

Select file
Calculation
CO2 balance

Upload BWA
Result history
Upload BWA Screen 1
Trend

S. Jones
Weber Logistics

Calculation
CO2 Balance
Upload BWA
Result History

Trend





0.005
0.004
0.003
0.002
0.001
0.000
1 Month
6 Months
1 Year
5 Years
10 Years
2020
2022
2023

2019
2021

1 CO2e
Time








0.003
Feb, 2021


CO2 Balance Period
CO2 Balance Month

Trend Screen
-
October 2022


Extracted Data
Step 2 of 2

Calculation
CO2 Balance

Extracted Data
Result History
Company Profile
eye

S. Jones
Weber Logistics
Gas

3,000
£
Electricity
Oil

Business Trips


4,240
Electricity, Water (x%)
2,000
£
3,987
Position Text (x%)
6,000
£

4,240
Electricity, Water (x%)
1,500
£
3,987
Position Text (x%)
Vehicle Costs

4,500
£
3,987
Position Text (x%)
1,500
£
4,923
Energy Sources (x%)
500
£
9,294
Heating Oil (x%)


To CO2 Balance

Back
save
trash
save
trash
save
trash
save
trash
save
trash
save
trash
save
trash


Extracted Data - Full View
Your CO2 balance
Calculated with bwa_example.pdf



Download CO2 balance
CO2e
for March 2021
11,155.68 t
4,000.20 t
4,000.20 t
2,906.20 t

Scope 1

Scope 2

Scope 3


Impacts


Scope 1
Direct emissions

4,000.20 t CO2e
Exact

Scope 1.1 Direct emissions from combustion processes of stationary plants (heating oil, natural gas)
Source: BWA
Preliminary
5.37 t CO2e
Scope 1.2 Direct emissions from fuel consumption of owned vehicles (leasing and ownership)
Source: BWA
Accurate
5.67 t CO2e
Scope 1.3 Direct emissions from volatile gases, leaks, and faulty piping when using air conditioning systems
Source: BWA
Very accurate
-- kg CO2e
Scope 1.4 Direct emissions from specific production processes (relevant for only a few industries)
Source: BWA
Preliminary
0.075 t CO2e


Scope 3
Upstream Emissions


0.075 t CO2e
Scope 1.4 Direct Emissions from specific production processes (relevant only for a few industries)
Source: BWA
Tentative

- kg CO2e
Scope 1.3 Direct Emissions of volatile gases, leaks, and faulty pipes from the use of air conditioning systems
Source: BWA
Very precise


5.37 t CO2e
Scope 3.1 Emissions from purchased goods and services (raw material extraction, production, and transport)
Source: BWA
Preliminary

Edit

2,906.20 t CO2e

5.67 t CO2e
Scope 1.2 Direct Emissions from fuel consumption of owned vehicles (leasing and ownership)
Source: BWA
Precise

Edit


This category cannot be edited
Very accurate

Scope 2
Indirect emissions from purchased energy
4,000.20 t CO2e


Preliminary
Scope 2.1 Indirect emissions from purchased electricity
Source: BWA
Preliminary
5.37 t CO2e
Scope 2.2 Indirect emissions from district heating/cooling
Source: BWA
Accurate
5.67 t CO2e
Scope 2.3 Indirect emissions from purchased steam
Source: BWA
Very accurate
1.37 t CO2e

S. Jones
Weber Logistik

Scope 3
Nachgelagerte Emissionen
-- t CO2e
Bald verfügbar!
Calculation
CO2 Balance
Results History

Result

Extracted Data
Upload BWA
Recent calculations
Trend

Scope 3
Downstream emissions
0.075 t CO2e
Scope 1.4 Direct emissions from specific production processes (relevant only for a few industries)
Source: BWA
Tentative
- kg CO2e
Scope 1.3 Direct emissions of volatile gases, leaks, and faulty pipes from the use of air conditioning systems
Source: BWA
Very precise

2,906.20 t CO2e
5.67 t CO2e
Source: BWA
Precise

Edit
This category cannot be edited
Scope 3.8 Emissions from the transport and distribution of goods or services between the company...
Source: BWA
Preliminary
5.37 t CO2e
Scope 3.9 Emissions from the transport and distribution of goods or services between the company...
Source: BWA
Accurate
5.67 t CO2e
Results Screen 1
Your CO2 balance
Calculated with bwa_example.pdf



Download CO2 balance

Scope 1
Direct emissions
4,000.20 t CO2e
Exact
Scope 1.1 Direct emissions from combustion processes of stationary plants (heating oil, natural gas)
Source: BWA
Preliminary
5.37 t CO2e
Scope 1.2 Direct emissions from fuel consumption of owned vehicles (leasing and ownership)
Source: BWA
Accurate
5.67 t CO2e
Scope 1.3 Direct emissions from volatile gases, leaks, and faulty piping when using air conditioning systems
Source: BWA
Very accurate
-- kg CO2e
Scope 1.4 Direct emissions from specific production processes (relevant for only a few industries)
Source: BWA
Preliminary
0.075 t CO2e

Scope 3
Upstream Emissions
0.075 t CO2e
Scope 1.4 Direct Emissions from specific production processes (relevant only for a few industries)
Source: BWA
Tentative
- kg CO2e
Scope 1.3 Direct Emissions of volatile gases, leaks, and faulty pipes from the use of air conditioning systems
Source: BWA
Very precise

5.37 t CO2e
Scope 3.1 Emissions from purchased goods and services (raw material extraction, production, and transport)
Source: BWA
Preliminary
Edit

2,906.20 t CO2e
5.67 t CO2e
Scope 1.2 Direct Emissions from fuel consumption of owned vehicles (leasing and ownership)
Source: BWA
Precise

Edit
This category cannot be edited
Very accurate
Scope 2
Indirect emissions from purchased energy
4,000.20 t CO2e

Preliminary
Scope 2.1 Indirect emissions from purchased electricity
Source: BWA
Preliminary
5.37 t CO2e
Scope 2.2 Indirect emissions from district heating/cooling
Source: BWA
Accurate
5.67 t CO2e
Scope 2.3 Indirect emissions from purchased steam
Source: BWA
Very accurate
1.37 t CO2e
S. Jones
Weber Logistik
Scope 3
Nachgelagerte Emissionen
-- t CO2e
Bald verfügbar!
Calculation
CO2 Balance
Results History
Result
Extracted Data
Upload BWA
Recent calculations
Trend

Scope 3
Downstream emissions
0.075 t CO2e
Scope 1.4 Direct emissions from specific production processes (relevant only for a few industries)
Source: BWA
Tentative
- kg CO2e
Scope 1.3 Direct emissions of volatile gases, leaks, and faulty pipes from the use of air conditioning systems
Source: BWA
Very precise
2,906.20 t CO2e
5.67 t CO2e
Source: BWA
Precise

Edit
This category cannot be edited
Scope 3.8 Emissions from the transport and distribution of goods or services between the company...
Source: BWA
Preliminary
5.37 t CO2e
Scope 3.9 Emissions from the transport and distribution of goods or services between the company...
Source: BWA
Accurate
5.67 t CO2e

Result
Industry
average
Your result





3,056.20 t CO2e


30%
4,000.20 t CO2e
1,300.20 t CO2e
50%
6,213.20 t CO2e
950.20 t CO2e

895 t CO2e
50%
20%
55%
45%
CO2 emissions

per employee

per €100,000 revenue


Scope 1


Scope 2


Scope 3


would need to be planted to offset your CO2 footprint
Results Screen 2
save
trash
save
trash
save
trash
Extracted Data
Step 2 of 2
Calculation
CO2 Balance
Upload BWA
Extracted Data
Result
Result History
Company Profile
eye

S. Jones
Weber Logistics
Vehicle Costs
i

4,500
£
Gas

3,000
£
Electricity
i
Oil

6,000
£
Business Trips
i
1,500
£

4240
Electricity, Water (x%)
2,000
£
3987
Position Text (x%)
6,000
£

4240
Gas, Electricity, Water (x%)
1,500
£

3987
Position Text (x%)
Vehicle Costs
i

4,500
£
4,500
£

3987
Position Text (x%)
1,500
£

4923
Energy Sources (x%)
500
£
9294
Heating Oil (x%)


To CO2 Balance

Back
January
April
July
October
February
May
August
November
March
June
September
December

2022


-
October 2022


Save
Reset
Period
Extracted Data - Reporting Period Selection
Upload & evaluate BWA
Step 1 of 2

S. Jones
Weber Logistics

Extract evaluation for bwa_example.pdf.
Approximately 1 minute remaining


76%
Result is being generated…

Select already uploaded file
Select file
Select file
Calculation
CO2 balance
Upload BWA
Result history
Upload BWA Screen 2

Upload & analyse BWA
Step 1 of 2

S. Jones
Weber Logistics
Select already uploaded file
Select file

Analysis for bwa_example.pdf.
Your BWA has been analysed


100%

Result

Back
Select file
Calculation
CO2 balance
Upload BWA
Result history
Upload BWA Screen 3







Learn more


Contact

Don't have any login credentials?
Contact us!
Forgot your password?

Email address

Password
eye
Login
Login
After logging in, you will be redirected to your bank's or license provider's subpage. They are the publishers of the respective subpage and are responsible for the content.
Back
Login Screen








Learn more


Contact
Back


My company is a customer of
Contact

First & Last Name

Company

Email Address

Bank
Please select

I agree that the selected bank (if not specified, then Volksbank Digital Solutions GmbH) may use my provided data to send me an email with my access details for gecco2.

Detailed analyses
Receive detailed
information and comparisons on
Scope 1 and Scope 2 emissions
of your company.
Coming soon: Scope 3


Send
Contact Screen
SCREENS
After rounds of user testing and stakeholder review, I received valuable feedback for improving both the Trend chart, the results screen, the Upload BWA screen, and some minor changes to the other screens as well:
Trend

S. Jones
Weber Logistics

Calculation
CO2 Balance
Upload BWA
Result History

Trend


0.005
0.004
0.003
0.002
0.001
0.000
1 Month
6 Months
1 Year
5 Years
10 Years
2020
2022
2023

2019
2021

1 CO2e
Time





0.003
Feb, 2021


CO2 Balance Period
CO2 Balance Month

SECOND DESIGN ITERATION -POST USER TESTING

Trend

S. Jones
Weber Logistics

Calculation
CO2 Balance
Upload BWA
Result History

Trend


0.005
0.004
0.003
0.002
0.001
0.000
0.005
0.004
0.003
0.002
0.001
0.000
6 Months
1 Year
5 Years
10 Years
2020
2022
2023

2019
2021

Monthly CO2e (t)
Period/Year CO2e (t)
Time





Month

Period/Year

Period/Year (Jan 2024 - Sep 2024): 123.23 t

Month (Jan 2021): 0.0030 t
Your CO2 balance
Calculated with bwa_example.pdf


Download CO2 balance


Scope 1
Direct emissions

4,000.20 t CO2e
Exact

Scope 1.1 Direct emissions from combustion processes of stationary plants (heating oil, natural gas)
Source: BWA
Preliminary
5.37 t CO2e

Edit
Scope 1.2 Direct emissions from fuel consumption of owned vehicles (leasing and ownership)
Source: BWA
Accurate
5.67 t CO2e

Edit

Scope 1.3 Direct emissions from volatile gases, leaks, and faulty piping when using air conditioning systems
Source: BWA
Very accurate
-- kg CO2e
Scope 1.4 Direct emissions from specific production processes (relevant for only a few industries)
Source: BWA
Preliminary
0.075 t CO2e


Scope 3
Upstream Emissions


0.075 t CO2e
Scope 1.4 Direct Emissions from specific production processes (relevant only for a few industries)
Source: BWA
Tentative

- kg CO2e
Scope 1.3 Direct Emissions of volatile gases, leaks, and faulty pipes from the use of air conditioning systems
Source: BWA
Very precise


5.37 t CO2e
Scope 3.1 Emissions from purchased goods and services (raw material extraction, production, and transport)
Source: BWA
Preliminary

Edit

2,906.20 t CO2e

5.67 t CO2e
Scope 1.2 Direct Emissions from fuel consumption of owned vehicles (leasing and ownership)
Source: BWA
Precise

Edit


This category cannot be edited
Very accurate

Scope 2
Indirect emissions from purchased energy
4,000.20 t CO2e


Preliminary
Scope 2.1 Indirect emissions from purchased electricity
Source: BWA
Preliminary
5.37 t CO2e

Edit
Scope 2.2 Indirect emissions from district heating/cooling
Source: BWA
Accurate
5.67 t CO2e

Edit
Scope 2.3 Indirect emissions from purchased steam
Source: BWA
Very accurate
1.37 t CO2e

S. Jones
Weber Logistik
Calculation
CO2 Balance
Results History

Result

Extracted Data
Upload BWA
Recent calculations
Trend

Scope 3
Downstream emissions
0.075 t CO2e
Scope 1.4 Direct emissions from specific production processes (relevant only for a few industries)
Source: BWA
Tentative
- kg CO2e
Scope 1.3 Direct emissions of volatile gases, leaks, and faulty pipes from the use of air conditioning systems
Source: BWA
Very precise

2,906.20 t CO2e
5.67 t CO2e
Source: BWA
Precise

Edit
This category cannot be edited
Scope 3.8 Emissions from the transport and distribution of goods or services between the company...
Source: BWA
Preliminary
5.37 t CO2e

Edit
Scope 3.9 Emissions from the transport and distribution of goods or services between the company...
Source: BWA
Accurate
5.67 t CO2e
Scope 2.1 Indirect emissions from purchased electricity
Source: BWA
Preliminary
5.37 t CO2e

Edit

Result
Industry
average
Your result





3,056.20 t CO2e


30%
4,000.20 t CO2e
1,300.20 t CO2e
50%
6,213.20 t CO2e
950.20 t CO2e

895 t CO2e
50%
20%
55%
45%
CO2 emissions

per employee

per €100,000 revenue


Scope 1


Scope 2


Scope 3


would need to be planted to offset your CO2 footprint
Your CO2 balance
Calculated with bwa_example.pdf


Download CO2 balance


Scope 1
Direct emissions

4,000.20 t CO2e
Exact

Scope 1.1 Direct emissions from combustion processes of stationary plants (heating oil, natural gas)
Source: BWA
Preliminary
5.37 t CO2e
Scope 1.2 Direct emissions from fuel consumption of owned vehicles (leasing and ownership)
Source: BWA
Accurate
5.67 t CO2e
Scope 1.3 Direct emissions from volatile gases, leaks, and faulty piping when using air conditioning systems
Source: BWA
Very accurate
-- kg CO2e
Scope 1.4 Direct emissions from specific production processes (relevant for only a few industries)
Source: BWA
Preliminary
0.075 t CO2e


Scope 3
Upstream Emissions


0.075 t CO2e
Scope 1.4 Direct Emissions from specific production processes (relevant only for a few industries)
Source: BWA
Tentative

- kg CO2e
Scope 1.3 Direct Emissions of volatile gases, leaks, and faulty pipes from the use of air conditioning systems
Source: BWA
Very precise


5.37 t CO2e
Scope 3.1 Emissions from purchased goods and services (raw material extraction, production, and transport)
Source: BWA
Preliminary

Edit

2,906.20 t CO2e

5.67 t CO2e
Scope 1.2 Direct Emissions from fuel consumption of owned vehicles (leasing and ownership)
Source: BWA
Precise

Edit


This category cannot be edited
Very accurate

Scope 2
Indirect emissions from purchased energy
4,000.20 t CO2e


Preliminary
Scope 2.1 Indirect emissions from purchased electricity
Source: BWA
Preliminary
5.37 t CO2e
Scope 2.2 Indirect emissions from district heating/cooling
Source: BWA
Accurate
5.67 t CO2e
Scope 2.3 Indirect emissions from purchased steam
Source: BWA
Very accurate
1.37 t CO2e

S. Jones
Weber Logistik

Scope 3
Nachgelagerte Emissionen
-- t CO2e
Bald verfügbar!
Calculation
CO2 Balance
Results History

Result

Extracted Data
Upload BWA
Recent calculations
Trend

Scope 3
Downstream emissions
0.075 t CO2e
Scope 1.4 Direct emissions from specific production processes (relevant only for a few industries)
Source: BWA
Tentative
- kg CO2e
Scope 1.3 Direct emissions of volatile gases, leaks, and faulty pipes from the use of air conditioning systems
Source: BWA
Very precise

2,906.20 t CO2e
5.67 t CO2e
Source: BWA
Precise

Edit
This category cannot be edited
Scope 3.8 Emissions from the transport and distribution of goods or services between the company...
Source: BWA
Preliminary
5.37 t CO2e
Scope 3.9 Emissions from the transport and distribution of goods or services between the company...
Source: BWA
Accurate
5.67 t CO2e

Result
Industry
average
Your result





3,056.20 t CO2e


30%
4,000.20 t CO2e
1,300.20 t CO2e
50%
6,213.20 t CO2e
950.20 t CO2e

895 t CO2e
50%
20%
55%
45%
CO2 emissions

per employee

per €100,000 revenue


Scope 1


Scope 2


Scope 3


would need to be planted to offset your CO2 footprint
On the updated Trends chart, the data points and tooltip now clearly display both the total CO₂
emissions for a selected period or year (e.g., Jan 2024–Sep 2024: 123.23 t) and the specific
value for a chosen month (e.g., Jan 2021: 0.0030 t).
The updated Results Screen now includes “EDIT” buttons, allowing users to manually adjust
Scope 1, 2, and 3 emissions directly to ensure more accurate CO₂ reporting.
Users can now manually enter and adjust their company’s data for Scope 1, 2, 3 emissions , allowing for more accurate and tailored CO₂ reporting.
As part of the second iteration, I improved the Extracted Data page by refining the alignment, grouping related items into clear collapsible sections,
and enhancing the overall layout—making it easier for users to review and enter their data accurately and efficiently.
For the BWA Upload screen, users needed clear examples of what type of BWA statement was required, so I added a carousel of real sample documents provided by Volksbank.
I also included a notification bar at the top for important information and translated all screens into German as requested.
Ihre CO2-Bilanz
Berechnet mit bwa_beispiel.pdf

Berechnung
CO2-Bilanz

Upload BWA
Ergebnishistorie

CO2-Bilanz herunterladen

CO2e
für März 2021
11.155,68 t
4.000,20 t
4.000,20 t
2.906,20 t

Scope 1

Scope 2

Scope 3


Auswirkungen


Details


Scope 1
Direkte Emissionen


0,075 t CO2e
Scope 1.4 Direkte Emissionen aus besonderen Produktionsprozessen (nur für wenige Branchen relevant)
Quelle: BWA
Vorläufig

-- kg CO2e
Scope 1.3 Direkte Emissionen flüchtiger Gase, Leckagen und undichte Leitungen durch den Einsatz von Klimaanlagen
Quelle: BWA


5,37 t CO2e
Scope 1.1 Direkte Emissionen aus Verbrennungsprozessen stationärer Anlagen (Heizöl, Erdgas)
Quelle: BWA
Vorläufig

4.000,20 t CO2e

5,67 t CO2e
Scope 1.2 Direkte Emissionen durch Kraftstoffverbrauch selbstgenutzter Fahrzeuge (Leasing und Eigentum)
Quelle: BWA
Präzise

Bearbeiten


Diese Kategorie ist nicht editierbar.

Bearbeiten
Sehr präzise


Scope 3
Vorgelagerte Emissionen


0,075 t CO2e
Scope 1.4 Direkte Emissionen aus besonderen Produktionsprozessen (nur für wenige Branchen relevant)
Quelle: BWA
Tentavive

- kg CO2e
Scope 1.3 Direkte Emissionen flüchtiger Gase, Leckagen und undichte Leitungen durch den Einsatz von Klimaanlagen
Quelle: BWA
Very precise


5,37 t CO2e
Scope 3.1 Emissionen der eingekauften Waren und Dienstleistungen (Rohstoffgewinnung, Produktion und Transport)
Quelle: BWA
Vorläufig

Edit

2.906,20 t CO2e

5,67 t CO2e
Scope 1.2 Direkte Emissionen durch Kraftstoffverbrauch selbstgenutzter Fahrzeuge (Leasing und Eigentum)
Quelle: BWA
Precise

Edit


This category is not
possible to edit


Scope 2
Indirekte Emissionen durch bezogene Energien
4.000,20 t CO2e


1,37 t CO2e
Scope 2.3 Indirekte Emissionen aus gekauftem Dampf
Quelle: BWA
Sehr präzise


5,37 t CO2e
Scope 2.1 Indirekte Emissionen aus gekauftem Strom
Quelle: BWA
Vorläufig

5,67 t CO2e
Scope 2.2 Indirekte Emissionen aus Fernwärme/-kälte
Quelle: BWA
Präzise

Bearbeiten
Bearbeiten

“Bitte beachten Sie: Aktuell ist keine Berechnung der
Emissionen für die Verbrennung von Holzelementen möglich.”

S. Jones
Weber Logistik

Scope 3
Nachgelagerte Emissionen
-- t CO2e
Bald verfügbar!


Direct emissions from combustion processes of stationary facilities (heating oil, natural gas)
Scope 1.1
Period: January 2022
To improve the accuracy of your calculation, choose one of the following options:

Please provide your company's natural gas costs and/or heating oil costs for the specified period:

-
Oil costs
€
-
€
Gas costs
If you fill in this data, your result will be accurate

Please provide your company's natural gas consumption and/or heating oil consumption for the specified period:
If you fill in this data, your result will be very accurate
Gas consumption

1,000
kWh
I
-
Oil consumption
Back to overview
Save
Preliminary
Ihre CO2-Bilanz
Berechnet mit bwa_beispiel.pdf
Berechnung
CO2-Bilanz
Upload BWA
Ergebnishistorie
CO2-Bilanz herunterladen

CO2e
für März 2021
11.155,68 t
4.000,20 t
4.000,20 t
2.906,20 t
Scope 1
Scope 2
Scope 3

Auswirkungen

Details

Scope 1
Direkte Emissionen
0,075 t CO2e
Scope 1.4 Direkte Emissionen aus besonderen Produktionsprozessen (nur für wenige Branchen relevant)
Quelle: BWA
Vorläufig
-- kg CO2e
Scope 1.3 Direkte Emissionen flüchtiger Gase, Leckagen und undichte Leitungen durch den Einsatz von Klimaanlagen
Quelle: BWA
5,37 t CO2e
Scope 1.1 Direkte Emissionen aus Verbrennungsprozessen stationärer Anlagen (Heizöl, Erdgas)
Quelle: BWA
Vorläufig

4.000,20 t CO2e
5,67 t CO2e
Scope 1.2 Direkte Emissionen durch Kraftstoffverbrauch selbstgenutzter Fahrzeuge (Leasing und Eigentum)
Quelle: BWA
Präzise

Bearbeiten
Diese Kategorie ist nicht editierbar.
Bearbeiten
Sehr präzise

Scope 3
Vorgelagerte Emissionen

0,075 t CO2e
Scope 1.4 Direkte Emissionen aus besonderen Produktionsprozessen (nur für wenige Branchen relevant)
Quelle: BWA
Tentavive
- kg CO2e
Scope 1.3 Direkte Emissionen flüchtiger Gase, Leckagen und undichte Leitungen durch den Einsatz von Klimaanlagen
Quelle: BWA
Very precise
5,37 t CO2e
Scope 3.1 Emissionen der eingekauften Waren und Dienstleistungen (Rohstoffgewinnung, Produktion und Transport)
Quelle: BWA
Vorläufig
Edit

2.906,20 t CO2e
5,67 t CO2e
Scope 1.2 Direkte Emissionen durch Kraftstoffverbrauch selbstgenutzter Fahrzeuge (Leasing und Eigentum)
Quelle: BWA
Precise
Edit
This category is not
possible to edit
Scope 2
Indirekte Emissionen durch bezogene Energien
4.000,20 t CO2e

1,37 t CO2e
Scope 2.3 Indirekte Emissionen aus gekauftem Dampf
Quelle: BWA
Sehr präzise

5,37 t CO2e
Scope 2.1 Indirekte Emissionen aus gekauftem Strom
Quelle: BWA
Vorläufig

5,67 t CO2e
Scope 2.2 Indirekte Emissionen aus Fernwärme/-kälte
Quelle: BWA
Präzise
Bearbeiten
Bearbeiten
“Bitte beachten Sie: Aktuell ist keine Berechnung der
Emissionen für die Verbrennung von Holzelementen möglich.”
S. Jones
Weber Logistik
Scope 3
Nachgelagerte Emissionen
-- t CO2e
Bald verfügbar!

Direct emissions from combustion processes of stationary installations (heating oil, natural gas)
Scope 1.1
To improve the accuracy of your calculation, choose one of the following options:

Please provide your company's natural gas costs and/or heating oil costs for the specified period:
-
Gas costs
€
-
€
Oil costs
If you fill in this data, your result will be accurate
Please provide your company's natural gas consumption and/or heating oil consumption for the specified period:
If you fill in this data, your result will be very accurate
Gas consumption
-
kWh
I
-
Oil consumption
Back to overview
Save
Preliminary
Ihre CO2-Bilanz
Berechnet mit bwa_beispiel.pdf

Berechnung
CO2-Bilanz

Upload BWA
Ergebnishistorie

CO2-Bilanz herunterladen

CO2e
für März 2021
11.155,68 t
4.000,20 t
4.000,20 t
2.906,20 t

Scope 1

Scope 2

Scope 3


Auswirkungen


Details


Scope 1
Direkte Emissionen


0,075 t CO2e
Scope 1.4 Direkte Emissionen aus besonderen Produktionsprozessen (nur für wenige Branchen relevant)
Quelle: BWA
Vorläufig

-- kg CO2e
Scope 1.3 Direkte Emissionen flüchtiger Gase, Leckagen und undichte Leitungen durch den Einsatz von Klimaanlagen
Quelle: BWA


5,37 t CO2e
Scope 1.1 Direkte Emissionen aus Verbrennungsprozessen stationärer Anlagen (Heizöl, Erdgas)
Quelle: BWA
Vorläufig

4.000,20 t CO2e

5,67 t CO2e
Scope 1.2 Direkte Emissionen durch Kraftstoffverbrauch selbstgenutzter Fahrzeuge (Leasing und Eigentum)
Quelle: BWA
Präzise
Bearbeiten


Diese Kategorie ist nicht editierbar.

Bearbeiten
Sehr präzise


Scope 3
Vorgelagerte Emissionen


0,075 t CO2e
Scope 1.4 Direkte Emissionen aus besonderen Produktionsprozessen (nur für wenige Branchen relevant)
Quelle: BWA
Tentavive

- kg CO2e
Scope 1.3 Direkte Emissionen flüchtiger Gase, Leckagen und undichte Leitungen durch den Einsatz von Klimaanlagen
Quelle: BWA
Very precise


5,37 t CO2e
Scope 3.1 Emissionen der eingekauften Waren und Dienstleistungen (Rohstoffgewinnung, Produktion und Transport)
Quelle: BWA
Vorläufig

Edit

2.906,20 t CO2e

5,67 t CO2e
Scope 1.2 Direkte Emissionen durch Kraftstoffverbrauch selbstgenutzter Fahrzeuge (Leasing und Eigentum)
Quelle: BWA
Precise
Edit


This category is not
possible to edit


Scope 2
Indirekte Emissionen durch bezogene Energien
4.000,20 t CO2e


1,37 t CO2e
Scope 2.3 Indirekte Emissionen aus gekauftem Dampf
Quelle: BWA
Sehr präzise


5,37 t CO2e
Scope 2.1 Indirekte Emissionen aus gekauftem Strom
Quelle: BWA
Vorläufig

5,67 t CO2e
Scope 2.2 Indirekte Emissionen aus Fernwärme/-kälte
Quelle: BWA
Präzise

Bearbeiten
Bearbeiten

“Bitte beachten Sie: Aktuell ist keine Berechnung der
Emissionen für die Verbrennung von Holzelementen möglich.”

S. Jones
Weber Logistik

Scope 3
Nachgelagerte Emissionen
-- t CO2e
Bald verfügbar!


Direct emissions from volatile gases, leaks, and faulty pipes when using air conditioning systems
Scope 1.3
Period: January 2022
To improve the accuracy of your calculation, choose one of the following options:

Please specify the total area cooled by air conditioning in your company.

-
Total area
sqm
If you fill in this data, your result will be very accurate

Please specify the total output of the air conditioning systems in your company for the selected period.
If you fill in this data, your result will be very accurate
Air conditioning systems

-
kWh
Back to overview
Save
Preliminary
Ihre CO2-Bilanz
Berechnet mit bwa_beispiel.pdf
Berechnung
CO2-Bilanz
Upload BWA
Ergebnishistorie
CO2-Bilanz herunterladen
CO2e
für März 2021
11.155,68 t
4.000,20 t
4.000,20 t
2.906,20 t
Scope 1
Scope 2
Scope 3

Auswirkungen

Details

Scope 1
Direkte Emissionen
0,075 t CO2e
Scope 1.4 Direkte Emissionen aus besonderen Produktionsprozessen (nur für wenige Branchen relevant)
Quelle: BWA
Vorläufig
-- kg CO2e
Scope 1.3 Direkte Emissionen flüchtiger Gase, Leckagen und undichte Leitungen durch den Einsatz von Klimaanlagen
Quelle: BWA

5,37 t CO2e
Scope 1.1 Direkte Emissionen aus Verbrennungsprozessen stationärer Anlagen (Heizöl, Erdgas)
Quelle: BWA
Vorläufig

4.000,20 t CO2e
5,67 t CO2e
Scope 1.2 Direkte Emissionen durch Kraftstoffverbrauch selbstgenutzter Fahrzeuge (Leasing und Eigentum)
Quelle: BWA
Präzise

Bearbeiten
Diese Kategorie ist nicht editierbar.
Bearbeiten
Sehr präzise

Scope 3
Vorgelagerte Emissionen
0,075 t CO2e
Scope 1.4 Direkte Emissionen aus besonderen Produktionsprozessen (nur für wenige Branchen relevant)
Quelle: BWA
Tentavive
- kg CO2e
Scope 1.3 Direkte Emissionen flüchtiger Gase, Leckagen und undichte Leitungen durch den Einsatz von Klimaanlagen
Quelle: BWA
Very precise

5,37 t CO2e
Scope 3.1 Emissionen der eingekauften Waren und Dienstleistungen (Rohstoffgewinnung, Produktion und Transport)
Quelle: BWA
Vorläufig
Edit
2.906,20 t CO2e
5,67 t CO2e
Scope 1.2 Direkte Emissionen durch Kraftstoffverbrauch selbstgenutzter Fahrzeuge (Leasing und Eigentum)
Quelle: BWA
Precise

Edit
This category is not
possible to edit
Scope 2
Indirekte Emissionen durch bezogene Energien
4.000,20 t CO2e
1,37 t CO2e
Scope 2.3 Indirekte Emissionen aus gekauftem Dampf
Quelle: BWA
Sehr präzise

5,37 t CO2e
Scope 2.1 Indirekte Emissionen aus gekauftem Strom
Quelle: BWA
Vorläufig

5,67 t CO2e
Scope 2.2 Indirekte Emissionen aus Fernwärme/-kälte
Quelle: BWA
Präzise

Bearbeiten
Bearbeiten
“Bitte beachten Sie: Aktuell ist keine Berechnung der
Emissionen für die Verbrennung von Holzelementen möglich.”
S. Jones
Weber Logistik
Scope 3
Nachgelagerte Emissionen
-- t CO2e
Bald verfügbar!


Direct emissions from fuel consumption of self-used vehicles (leasing and ownership)
Scope 1.2
Period: January 2022
To improve the accuracy of your calculation, please select one of the following options:

Please specify the total litres of diesel/petrol consumed during the selected period by all vehicles used by your company (leasing or ownership).

-
Diesel
l
-
l
Petrol
If you fill in this data, your result will be very accurate

Estimate the total kilometres driven during the selected period by all vehicles used by your company (leasing or ownership).
If you fill in this data, your result will be accurate
Kilometres driven
-
km

Please specify the total kilometres driven during the selected period by all vehicles used by your company (leasing or ownership).
If you fill in this data, your result will be very accurate
Kilometres driven
-
km
Back to overview
Save
Accurate
-
October 2022


Extracted Data
Step 2 of 2

Calculation
CO2 Balance

Extracted Data
Result History
Company Profile
eye

S. Jones
Weber Logistics
Gas

3,000
£
Electricity
Oil


Business Trips


4,240
Electricity, Water (x%)
2,000
£
3,987
Position Text (x%)
6,000
£

4,240
Gas, Electricity, Water (x%)
1,500
£
3,987
Position Text (x%)
Vehicle Costs
4,500
£
3,987
Position Text (x%)
1,500
£

4,923
Energy Sources (x%)
500
£
9,294
Heating Oil (x%)


To CO2 Balance

Back
save
trash
save
trash
save
trash
save
trash
save
trash
save
trash
save
trash


Extracted Data
Step 2 of 2

Calculation
CO2 Balance

Extracted Data
Result History

S. Jones
Weber Logistics
Company Profile
eye
Gas
(5,000 €)


4240
Gas, Electricity, Water (x%)
3,000
€
trash
save
3987
Position Text (x%)
2,000
€
trash
save
Oil
(2,000 €)

4923
Energy Materials (x%)
1,500
€
trash
save
9294
Heating Oil (x%)
500
€
trash
save
Electricity
(6,000 €)

4240
Gas, Electricity, Water (x%)
6,000
€
trash
save

To the CO2 Balance

Back
Upload & evaluate BWA
Step 1 of 2

S. Jones
Weber Logistics


Drag & drop your BWA here
or use the “Select File” button.
Please use a .pdf format.


Select previously uploaded file

Select file

Select file
Calculation
CO2 balance

Upload BWA
Result history
BWA hochladen & berechnen
Schritt 1 von 2

Berechnung
CO2-Bilanz
Upload BWA
Ergebnishistorie

S. Jones
Weber Logistik

Sie nutzen aktuell gecco₂ Pro. Damit können Sie für 12 Monate unbegrenzt viele Detail-Berechnungen Ihres CO₂-Abdrucks durchführen.

Aktuell werden nur .pdf Formate unterstützt
BWA hier reinziehen
oder
Datei auswählen
Anzahl verfügbarer Basic-Berechnungen: 1

Zurück

Berechnung starten
Anforderungen an Ihre BWA:
1
Nutzen Sie für den Upload eine BWA mit Summen- und Saldenliste, z.B. von DATEV, Addison oder Lexware.
Die Verwendung der Standardkontenrahmen SK03 oder SK04 erleichtert zudem das Auslesen der Datei.


LIVE VERSION - GECCO2
LIVE VERSION - PROECO

Digital CO₂ Solution for Volksbank Pur
Trend





0.005
0.004
0.003
0.002
0.001
0.000
0.005
0.004
0.003
0.002
0.001
0.000
6 Months
1 Year
5 Years
10 Years
2020
2022
2023

2019
2021

Month CO2e (t)
Period/Year CO2e (t)
Time








Month

Period/Year

Period/Year (Jan 2024 - Sep 2024): 123.23 t

Month (Jan 2021): 0.0030 t
Your industry comparison
Calculated with bwa_example.pdf
Result

Industry average
Your result





3,056.20 t CO2e


30%
4,000.20 t CO2e
1,300.20 t CO2e
50%
6,213.20 t CO2e
950.20 t CO2e

895 t CO2e
50%
20%
55%
45%
CO2 emissions

per employee

per €100,000 revenue


Download CO2 balance

800 trees


Calculation CO2 balance
Upload BWA
Extracted data

Result
Result history
Scope 1


Scope 2


Scope 3


would need to be planted to offset your CO2 balance
DEVELOPED FOR
MY ROLE
- User Research
(interviews, desk research, stakeholder workshops)
- End-to-End UX/UI Design
- Usability Testing & Iteration
- Design System Alignment
- Cross-functional Collaboration (Product, Developers)
- Design Handover & QA
PROJECT DURATION
- 10 Months (Discovery -Launch)
- 2025
CLIENTS
- VolksbankPur
- Sparkasse, and Partners
Gecco2 is a digital sustainability assistant that enables small- and medium-sized enterprises (SMEs) to quickly calculate, analyze, and monitor their CO₂ emissions using their existing financial documents (BWA). This project was launched in collaboration with VolksbankPur and later extended to Sparkasse (ProEco), providing their SME clients with a simple, certified tool to support their sustainability journey and regulatory requirements.
I started out with a series of interviews with Volksbank Pur staff to understand firsthand their clients’ pain points and expectations regarding CO₂ reporting. I then documented key responses from these interviews, along with insights from additional research, and categorized them into clear feature priorities:
After conducting the stakeholder interviews and synthesizing the key insights, I started out by creating a user journey map to visualize each stage of the User’s experience with Gecco2 —from initial contact by the bank, through registration and BWA document upload, to receiving and sharing their CO₂ report. This helped me identify key pain points, emotional highs and lows, and opportunities for improving clarity and ease-of-use across the entire customer journey.
Here, I focused on illustrating the exact journey a user would follow within Gecco2 and ProEcco— from landing on the platform, registering, uploading their BWA, and reviewing extracted data, to downloading their certified CO₂ report. This allowed me to pinpoint where users might need extra guidance, and refine the flow so even non-technical business clients could complete the process smoothly and with confidence, all in just a few intuitive steps.
After defining the user flow, I structured the information architecture to group related tasks together and keep the interface intuitive. Here, I defined clear modules for CO₂ calculation, result history, data trends, optimizations, and account settings—making sure every function was logically placed and that users could always find what they needed with minimal clicks.

End user’s journey map
Project brief
Analyse &
Synthesise
Define
opportunities
Research to
understand
the problem
& users


Research
Analyse

End user
actions
Service
Phase
Tasks
Thoughts& emotions
Recommend-ations
- Filling personal info.
- Checking email
- Clicking a link
- Check the result
- Filling missing parts
- It is hussle that I have to compare BWA with the system
- It says it is inaccurate and my rate is quite low. I don’t think i can use it.
- I have to fill in all again. Why did I need to upload BWA?
- I can not go back
- The result looks good finally
- can I just send it over directly?
- Giving two options: A: BWA / B: Input filed with info. Benefit of using BWA
Banefit of inputting
- Option to open BWA you just uploaded
- Feature for direct sending over
- Inputting data manually
(amount of usage)
- Clicking next
- Check the data
- Donloading the result
- Open my folder
- Open my email & send
- Click to upload
- Waiting until it is complete
VB company
consultant
Receiving
Link
Sales:
email, phone calls
Registration
Upload BWA
Showing
the result
Clink to improve the accuracy
Showing the result
Sending it over




Before
Begining
During
After
🙂
🙂
🙂
🤯
🤔
🤔
😊

Project brief
Analyse &
Synthesise
Define
opportunities
Research to
understand
the problem
& users


Research
Analyse
Landing page
Start / End
Home screen
Upload &
calculate BWA
Manual review
Screen
Choose a file
or
Select a file
Show the result
or
Return
Upload
Show the result
Select
Return
- Payment pop-up
- Company profle
- Filling information
- Waiting
- Waiting

Registration
Calculate
your co2
Start
calculation
Save on
computer
Decision

Action


Result page
pop-ups
Download
or
Improve
Download
Improve
Scope 1
Scope 2


Business clients of Volksbank Pur and Sparkasse (especially SMEs) needed an intuitive, trustworthy way to assess and track their company’s CO₂ footprint, especially with evolving ESG reporting standards and increasing pressure from partners, clients, and regulators. Traditional CO₂ calculators were either too complex, manual, or inaccurate for the average business owner or finance manager.
1. Project Overview
2. The Challenge
- UNDERSTANDING THE USER
- DISCOVERY & INSIGHT GENERATION
- GETTING TO WORK
THE PROBLEM
TARGET AUDIENCE
CUSTOMER JOURNEY MAPPING
CUSTOMER USER FLOW
INFORMATION ARCHITECTURE
USER & STAKEHOLDER INTERVIEWS
BUSINESS GOALS

Provide an easy-to-use, self-service platform for Volksbank Pur and Sparkasse clients to generate certified CO₂ reports from their standard financial documents.
Position Volksbank Pur and Sparkasse as digital innovators by integrating sustainability into their value-added services.
Help businesses comply with ESG and supply chain reporting requirements without needing additional external consulting.
Business owners, accountants, and finance managers of small and medium-sized enterprises who are customers of Volksbank Pur or Sparkasse.
Typically non-specialists in climate or sustainability topics, focused on practical business outcomes.

Project brief
Analyse &
Synthesise
Define
opportunities
Research to
understand
the problem
& users


Research
Analyse
Landing page
contact VDS
Log in
Start Caculate Co2
Profile / Name
Upload BWA
Password change
picture and name change
Choose picture
Password setting pop ups
Change plan
pop ups
Quitting Subscription
pop ups
company profile change
pop ups
Payment change
pop ups
Subscription change
Quitting Subscription
Company profile
List of receipts
download
contact detail
Search
FAQ
Payment
Calcurate co2 emission
Extracted data
Calculation result
Result / improvement
Extracted data analysis
Result analysis

Improvement pop-ups
Last calculations
Result history
Setting
Rechnungen
Support
Trend
- Moved from setting
- Inactive
- Deleted






After finalizing the information architecture and sketching wireframes to define the skeletal structure of the platform, I began designing the core entry screens: the landing page, contact, and login screens. On the header navigation, users can immediately access “Contact” and “Login” for support or account access. The hero section includes a brief description of the platform’s benefits and a “Calculate CO₂ footprint” button that serves as the main entry point into the calculation workflow:
Once the user clicks the "Calculate CO₂ footprint" button, the user is redirected to the Upload BWA Screen where they can submit their BWA financial statement as a PDF. This document is then used to extract relevant financial data and automatically calculate the company's CO₂ emissions:
On the Trend Screen, users can see and compare their company’s CO₂ balance across different time periods—like 1 month, 6 months, 1 year, 5 years, or 10 years by switching though the tabs on top of the chart. The graph displays two lines: the orange line tracks your monthly CO₂ balance, while the green line shows the average over a selected period:
After the user uploads their BWA financial statement, they are taken to the next screen where all relevant data automatically extracted from the BWA document is clearly displayed. Data for categories such as Gas, Electricity, Oil, and others are pre-filled, and the user can also select the reporting period directly from the calendar:
After verifying and adjusting their extracted data, the user arrives at the results screen. On the results screen, users see their total CO₂ balance clearly divided into Scopes 1, 2, and 3. Each section provides a breakdown of emission sources and indicates the accuracy or status of the data. Users can compare their results against industry benchmarks and instantly download a comprehensive CO₂ report:








1
4
7
0
2
5
8
3
6
9
*
=
+
-
%

0.00


Learn more

The smart sustainability assistant for your business
The fastest current analysis for climate protection: From the financial statement to the carbon footprint in just a few minutes. Start your calculation now.
Login
Contact
Calculate CO2 footprint
Landing Page
Upload & evaluate BWA
Step 1 of 2

S. Jones
Weber Logistics


Drag & drop your BWA here
or use the “Select File” button.
Please use a .pdf format.


Select previously uploaded file

Select file

Select file
Calculation
CO2 balance

Upload BWA
Result history
Upload BWA Screen 1
Trend

S. Jones
Weber Logistics

Calculation
CO2 Balance
Upload BWA
Result History

Trend





0.005
0.004
0.003
0.002
0.001
0.000
1 Month
6 Months
1 Year
5 Years
10 Years
2020
2022
2023

2019
2021

1 CO2e
Time








0.003
Feb, 2021


CO2 Balance Period
CO2 Balance Month

Trend Screen
-
October 2022


Extracted Data
Step 2 of 2

Calculation
CO2 Balance

Extracted Data
Result History
Company Profile
eye

S. Jones
Weber Logistics
Gas

3,000
£
Electricity
Oil

Business Trips


4,240
Electricity, Water (x%)
2,000
£
3,987
Position Text (x%)
6,000
£

4,240
Electricity, Water (x%)
1,500
£
3,987
Position Text (x%)
Vehicle Costs

4,500
£
3,987
Position Text (x%)
1,500
£
4,923
Energy Sources (x%)
500
£
9,294
Heating Oil (x%)


To CO2 Balance

Back
save
trash
save
trash
save
trash
save
trash
save
trash
save
trash
save
trash


Extracted Data - Full View
Your CO2 balance
Calculated with bwa_example.pdf



Download CO2 balance
CO2e
for March 2021
11,155.68 t
4,000.20 t
4,000.20 t
2,906.20 t

Scope 1

Scope 2

Scope 3


Impacts


Scope 1
Direct emissions

4,000.20 t CO2e
Exact

Scope 1.1 Direct emissions from combustion processes of stationary plants (heating oil, natural gas)
Source: BWA
Preliminary
5.37 t CO2e
Scope 1.2 Direct emissions from fuel consumption of owned vehicles (leasing and ownership)
Source: BWA
Accurate
5.67 t CO2e
Scope 1.3 Direct emissions from volatile gases, leaks, and faulty piping when using air conditioning systems
Source: BWA
Very accurate
-- kg CO2e
Scope 1.4 Direct emissions from specific production processes (relevant for only a few industries)
Source: BWA
Preliminary
0.075 t CO2e


Scope 3
Upstream Emissions


0.075 t CO2e
Scope 1.4 Direct Emissions from specific production processes (relevant only for a few industries)
Source: BWA
Tentative

- kg CO2e
Scope 1.3 Direct Emissions of volatile gases, leaks, and faulty pipes from the use of air conditioning systems
Source: BWA
Very precise


5.37 t CO2e
Scope 3.1 Emissions from purchased goods and services (raw material extraction, production, and transport)
Source: BWA
Preliminary

Edit

2,906.20 t CO2e

5.67 t CO2e
Scope 1.2 Direct Emissions from fuel consumption of owned vehicles (leasing and ownership)
Source: BWA
Precise

Edit


This category cannot be edited
Very accurate

Scope 2
Indirect emissions from purchased energy
4,000.20 t CO2e


Preliminary
Scope 2.1 Indirect emissions from purchased electricity
Source: BWA
Preliminary
5.37 t CO2e
Scope 2.2 Indirect emissions from district heating/cooling
Source: BWA
Accurate
5.67 t CO2e
Scope 2.3 Indirect emissions from purchased steam
Source: BWA
Very accurate
1.37 t CO2e

S. Jones
Weber Logistik

Scope 3
Nachgelagerte Emissionen
-- t CO2e
Bald verfügbar!
Calculation
CO2 Balance
Results History

Result

Extracted Data
Upload BWA
Recent calculations
Trend

Scope 3
Downstream emissions
0.075 t CO2e
Scope 1.4 Direct emissions from specific production processes (relevant only for a few industries)
Source: BWA
Tentative
- kg CO2e
Scope 1.3 Direct emissions of volatile gases, leaks, and faulty pipes from the use of air conditioning systems
Source: BWA
Very precise
2,906.20 t CO2e
5.67 t CO2e
Source: BWA
Precise
Edit
This category cannot be edited
Scope 3.8 Emissions from the transport and distribution of goods or services between the company...
Source: BWA
Preliminary
5.37 t CO2e
Scope 3.9 Emissions from the transport and distribution of goods or services between the company...
Source: BWA
Accurate
5.67 t CO2e
Results Screen 1
Your CO2 balance
Calculated with bwa_example.pdf



Download CO2 balance

Scope 1
Direct emissions
4,000.20 t CO2e
Exact
Scope 1.1 Direct emissions from combustion processes of stationary plants (heating oil, natural gas)
Source: BWA
Preliminary
5.37 t CO2e
Scope 1.2 Direct emissions from fuel consumption of owned vehicles (leasing and ownership)
Source: BWA
Accurate
5.67 t CO2e
Scope 1.3 Direct emissions from volatile gases, leaks, and faulty piping when using air conditioning systems
Source: BWA
Very accurate
-- kg CO2e
Scope 1.4 Direct emissions from specific production processes (relevant for only a few industries)
Source: BWA
Preliminary
0.075 t CO2e
Scope 3
Upstream Emissions
0.075 t CO2e
Scope 1.4 Direct Emissions from specific production processes (relevant only for a few industries)
Source: BWA
Tentative
- kg CO2e
Scope 1.3 Direct Emissions of volatile gases, leaks, and faulty pipes from the use of air conditioning systems
Source: BWA
Very precise
5.37 t CO2e
Scope 3.1 Emissions from purchased goods and services (raw material extraction, production, and transport)
Source: BWA
Preliminary
Edit

2,906.20 t CO2e
5.67 t CO2e
Scope 1.2 Direct Emissions from fuel consumption of owned vehicles (leasing and ownership)
Source: BWA
Precise

Edit
This category cannot be edited
Very accurate
Scope 2
Indirect emissions from purchased energy
4,000.20 t CO2e

Preliminary
Scope 2.1 Indirect emissions from purchased electricity
Source: BWA
Preliminary
5.37 t CO2e
Scope 2.2 Indirect emissions from district heating/cooling
Source: BWA
Accurate
5.67 t CO2e
Scope 2.3 Indirect emissions from purchased steam
Source: BWA
Very accurate
1.37 t CO2e
S. Jones
Weber Logistik
Scope 3
Nachgelagerte Emissionen
-- t CO2e
Bald verfügbar!
Calculation
CO2 Balance
Results History
Result
Extracted Data
Upload BWA
Recent calculations
Trend
Scope 3
Downstream emissions
0.075 t CO2e
Scope 1.4 Direct emissions from specific production processes (relevant only for a few industries)
Source: BWA
Tentative
- kg CO2e
Scope 1.3 Direct emissions of volatile gases, leaks, and faulty pipes from the use of air conditioning systems
Source: BWA
Very precise

2,906.20 t CO2e
5.67 t CO2e
Source: BWA
Precise

Edit
This category cannot be edited
Scope 3.8 Emissions from the transport and distribution of goods or services between the company...
Source: BWA
Preliminary
5.37 t CO2e
Scope 3.9 Emissions from the transport and distribution of goods or services between the company...
Source: BWA
Accurate
5.67 t CO2e

Result
Industry
average
Your result





3,056.20 t CO2e


30%
4,000.20 t CO2e
1,300.20 t CO2e
50%
6,213.20 t CO2e
950.20 t CO2e

895 t CO2e
50%
20%
55%
45%
CO2 emissions

per employee

per €100,000 revenue


Scope 1


Scope 2


Scope 3


would need to be planted to offset your CO2 footprint
Results Screen 2
save
trash
save
trash
save
trash
Extracted Data
Step 2 of 2

Calculation
CO2 Balance
Upload BWA
Extracted Data
Result
Result History
Company Profile
eye

S. Jones
Weber Logistics
Vehicle Costs
i

4,500
£
Gas

3,000
£
Electricity
i
Oil

6,000
£
Business Trips
i
1,500
£

4240
Electricity, Water (x%)
2,000
£
3987
Position Text (x%)
6,000
£

4240
Gas, Electricity, Water (x%)
1,500
£
3987
Position Text (x%)
Vehicle Costs
i
4,500
£
4,500
£
3987
Position Text (x%)
1,500
£
4923
Energy Sources (x%)
500
£
9294
Heating Oil (x%)


To CO2 Balance

Back
January
April
July
October
February
May
August
November
March
June
September
December

2022


-
October 2022


Save
Reset
Period
Extracted Data - Reporting Period Selection
Upload & evaluate BWA
Step 1 of 2

S. Jones
Weber Logistics

Extract evaluation for bwa_example.pdf.
Approximately 1 minute remaining


76%
Result is being generated…

Select already uploaded file
Select file
Select file
Calculation
CO2 balance
Upload BWA
Result history
Upload BWA Screen 2
Upload & analyse BWA
Step 1 of 2
S. Jones
Weber Logistics
Select already uploaded file
Select file

Analysis for bwa_example.pdf.
Your BWA has been analysed

100%

Result

Back
Select file
Calculation
CO2 balance
Upload BWA
Result history
Upload BWA Screen 3







Learn more


Contact

Don't have any login credentials?
Contact us!
Forgot your password?

Email address

Password
eye
Login
Login
After logging in, you will be redirected to your bank's or license provider's subpage. They are the publishers of the respective subpage and are responsible for the content.
Back
Login Screen








Learn more


Contact
Back


My company is a customer of
Contact

First & Last Name

Company

Email Address

Bank
Please select

I agree that the selected bank (if not specified, then Volksbank Digital Solutions GmbH) may use my provided data to send me an email with my access details for gecco2.

Detailed analyses
Receive detailed
information and comparisons on
Scope 1 and Scope 2 emissions
of your company.
Coming soon: Scope 3


Send
Contact Screen
SCREENS
After rounds of user testing and stakeholder review, I received valuable feedback for improving both the Trend chart, the results screen, the Upload BWA screen, and some minor changes to the other screens as well:
Trend

S. Jones
Weber Logistics

Calculation
CO2 Balance
Upload BWA
Result History

Trend


0.005
0.004
0.003
0.002
0.001
0.000
1 Month
6 Months
1 Year
5 Years
10 Years
2020
2022
2023

2019
2021

1 CO2e
Time







0.003
Feb, 2021


CO2 Balance Period
CO2 Balance Month

SECOND DESIGN ITERATION -POST USER TESTING

Trend

S. Jones
Weber Logistics

Calculation
CO2 Balance
Upload BWA
Result History

Trend


0.005
0.004
0.003
0.002
0.001
0.000
0.005
0.004
0.003
0.002
0.001
0.000
6 Months
1 Year
5 Years
10 Years
2020
2022
2023

2019
2021

Monthly CO2e (t)
Period/Year CO2e (t)
Time







Month

Period/Year

Period/Year (Jan 2024 - Sep 2024): 123.23 t

Month (Jan 2021): 0.0030 t
Your CO2 balance
Calculated with bwa_example.pdf



Download CO2 balance


Scope 1
Direct emissions

4,000.20 t CO2e
Exact

Scope 1.1 Direct emissions from combustion processes of stationary plants (heating oil, natural gas)
Source: BWA
Preliminary
5.37 t CO2e

Edit
Scope 1.2 Direct emissions from fuel consumption of owned vehicles (leasing and ownership)
Source: BWA
Accurate
5.67 t CO2e

Edit

Scope 1.3 Direct emissions from volatile gases, leaks, and faulty piping when using air conditioning systems
Source: BWA
Very accurate
-- kg CO2e
Scope 1.4 Direct emissions from specific production processes (relevant for only a few industries)
Source: BWA
Preliminary
0.075 t CO2e


Scope 3
Upstream Emissions


0.075 t CO2e
Scope 1.4 Direct Emissions from specific production processes (relevant only for a few industries)
Source: BWA
Tentative

- kg CO2e
Scope 1.3 Direct Emissions of volatile gases, leaks, and faulty pipes from the use of air conditioning systems
Source: BWA
Very precise


5.37 t CO2e
Scope 3.1 Emissions from purchased goods and services (raw material extraction, production, and transport)
Source: BWA
Preliminary

Edit

2,906.20 t CO2e

5.67 t CO2e
Scope 1.2 Direct Emissions from fuel consumption of owned vehicles (leasing and ownership)
Source: BWA
Precise

Edit


This category cannot be edited
Very accurate

Scope 2
Indirect emissions from purchased energy
4,000.20 t CO2e


Preliminary
Scope 2.1 Indirect emissions from purchased electricity
Source: BWA
Preliminary
5.37 t CO2e

Edit
Scope 2.2 Indirect emissions from district heating/cooling
Source: BWA
Accurate
5.67 t CO2e

Edit
Scope 2.3 Indirect emissions from purchased steam
Source: BWA
Very accurate
1.37 t CO2e

S. Jones
Weber Logistik
Calculation
CO2 Balance
Results History

Result

Extracted Data
Upload BWA
Recent calculations
Trend

Scope 3
Downstream emissions
0.075 t CO2e
Scope 1.4 Direct emissions from specific production processes (relevant only for a few industries)
Source: BWA
Tentative
- kg CO2e
Scope 1.3 Direct emissions of volatile gases, leaks, and faulty pipes from the use of air conditioning systems
Source: BWA
Very precise

2,906.20 t CO2e
5.67 t CO2e
Source: BWA
Precise


Edit
This category cannot be edited
Scope 3.8 Emissions from the transport and distribution of goods or services between the company...
Source: BWA
Preliminary
5.37 t CO2e

Edit
Scope 3.9 Emissions from the transport and distribution of goods or services between the company...
Source: BWA
Accurate
5.67 t CO2e
Scope 2.1 Indirect emissions from purchased electricity
Source: BWA
Preliminary
5.37 t CO2e

Edit

Result
Industry
average
Your result





3,056.20 t CO2e


30%
4,000.20 t CO2e
1,300.20 t CO2e
50%
6,213.20 t CO2e
950.20 t CO2e

895 t CO2e
50%
20%
55%
45%
CO2 emissions

per employee

per €100,000 revenue


Scope 1


Scope 2


Scope 3


would need to be planted to offset your CO2 footprint
Your CO2 balance
Calculated with bwa_example.pdf



Download CO2 balance


Scope 1
Direct emissions

4,000.20 t CO2e
Exact

Scope 1.1 Direct emissions from combustion processes of stationary plants (heating oil, natural gas)
Source: BWA
Preliminary
5.37 t CO2e
Scope 1.2 Direct emissions from fuel consumption of owned vehicles (leasing and ownership)
Source: BWA
Accurate
5.67 t CO2e
Scope 1.3 Direct emissions from volatile gases, leaks, and faulty piping when using air conditioning systems
Source: BWA
Very accurate
-- kg CO2e
Scope 1.4 Direct emissions from specific production processes (relevant for only a few industries)
Source: BWA
Preliminary
0.075 t CO2e


Scope 3
Upstream Emissions


0.075 t CO2e
Scope 1.4 Direct Emissions from specific production processes (relevant only for a few industries)
Source: BWA
Tentative

- kg CO2e
Scope 1.3 Direct Emissions of volatile gases, leaks, and faulty pipes from the use of air conditioning systems
Source: BWA
Very precise


5.37 t CO2e
Scope 3.1 Emissions from purchased goods and services (raw material extraction, production, and transport)
Source: BWA
Preliminary

Edit

2,906.20 t CO2e

5.67 t CO2e
Scope 1.2 Direct Emissions from fuel consumption of owned vehicles (leasing and ownership)
Source: BWA
Precise

Edit


This category cannot be edited
Very accurate

Scope 2
Indirect emissions from purchased energy
4,000.20 t CO2e


Preliminary
Scope 2.1 Indirect emissions from purchased electricity
Source: BWA
Preliminary
5.37 t CO2e
Scope 2.2 Indirect emissions from district heating/cooling
Source: BWA
Accurate
5.67 t CO2e
Scope 2.3 Indirect emissions from purchased steam
Source: BWA
Very accurate
1.37 t CO2e

S. Jones
Weber Logistik

Scope 3
Nachgelagerte Emissionen
-- t CO2e
Bald verfügbar!
Calculation
CO2 Balance
Results History

Result

Extracted Data
Upload BWA
Recent calculations
Trend

Scope 3
Downstream emissions
0.075 t CO2e
Scope 1.4 Direct emissions from specific production processes (relevant only for a few industries)
Source: BWA
Tentative
- kg CO2e
Scope 1.3 Direct emissions of volatile gases, leaks, and faulty pipes from the use of air conditioning systems
Source: BWA
Very precise

2,906.20 t CO2e
5.67 t CO2e
Source: BWA
Precise

Edit
This category cannot be edited
Scope 3.8 Emissions from the transport and distribution of goods or services between the company...
Source: BWA
Preliminary
5.37 t CO2e
Scope 3.9 Emissions from the transport and distribution of goods or services between the company...
Source: BWA
Accurate
5.67 t CO2e

Result
Industry
average
Your result





3,056.20 t CO2e


30%
4,000.20 t CO2e
1,300.20 t CO2e
50%
6,213.20 t CO2e
950.20 t CO2e

895 t CO2e
50%
20%
55%
45%
CO2 emissions

per employee

per €100,000 revenue


Scope 1


Scope 2


Scope 3


would need to be planted to offset your CO2 footprint
On the updated Trends chart, the data points and tooltip now clearly display both the total CO₂
emissions for a selected period or year (e.g., Jan 2024–Sep 2024: 123.23 t) and the specific
value for a chosen month (e.g., Jan 2021: 0.0030 t).
The updated Results Screen now includes “EDIT” buttons, allowing users to manually adjust
Scope 1, 2, and 3 emissions directly to ensure more accurate CO₂ reporting.
Users can now manually enter and adjust their company’s data for Scope 1, 2, 3 emissions , allowing for more accurate and tailored CO₂ reporting.
As part of the second iteration, I improved the Extracted Data page by refining the alignment, grouping related items into clear collapsible sections,
and enhancing the overall layout—making it easier for users to review and enter their data accurately and efficiently.
For the BWA Upload screen, users needed clear examples of what type of BWA statement was required, so I added a carousel of real sample documents provided by Volksbank.
I also included a notification bar at the top for important information and translated all screens into German as requested.
Ihre CO2-Bilanz
Berechnet mit bwa_beispiel.pdf

Berechnung
CO2-Bilanz

Upload BWA
Ergebnishistorie

CO2-Bilanz herunterladen

CO2e
für März 2021
11.155,68 t
4.000,20 t
4.000,20 t
2.906,20 t

Scope 1

Scope 2

Scope 3


Auswirkungen


Details


Scope 1
Direkte Emissionen


0,075 t CO2e
Scope 1.4 Direkte Emissionen aus besonderen Produktionsprozessen (nur für wenige Branchen relevant)
Quelle: BWA
Vorläufig

-- kg CO2e
Scope 1.3 Direkte Emissionen flüchtiger Gase, Leckagen und undichte Leitungen durch den Einsatz von Klimaanlagen
Quelle: BWA


5,37 t CO2e
Scope 1.1 Direkte Emissionen aus Verbrennungsprozessen stationärer Anlagen (Heizöl, Erdgas)
Quelle: BWA
Vorläufig

4.000,20 t CO2e

5,67 t CO2e
Scope 1.2 Direkte Emissionen durch Kraftstoffverbrauch selbstgenutzter Fahrzeuge (Leasing und Eigentum)
Quelle: BWA
Präzise

Bearbeiten


Diese Kategorie ist nicht editierbar.

Bearbeiten
Sehr präzise


Scope 3
Vorgelagerte Emissionen


0,075 t CO2e
Scope 1.4 Direkte Emissionen aus besonderen Produktionsprozessen (nur für wenige Branchen relevant)
Quelle: BWA
Tentavive

- kg CO2e
Scope 1.3 Direkte Emissionen flüchtiger Gase, Leckagen und undichte Leitungen durch den Einsatz von Klimaanlagen
Quelle: BWA
Very precise


5,37 t CO2e
Scope 3.1 Emissionen der eingekauften Waren und Dienstleistungen (Rohstoffgewinnung, Produktion und Transport)
Quelle: BWA
Vorläufig

Edit

2.906,20 t CO2e

5,67 t CO2e
Scope 1.2 Direkte Emissionen durch Kraftstoffverbrauch selbstgenutzter Fahrzeuge (Leasing und Eigentum)
Quelle: BWA
Precise

Edit


This category is not
possible to edit


Scope 2
Indirekte Emissionen durch bezogene Energien
4.000,20 t CO2e


1,37 t CO2e
Scope 2.3 Indirekte Emissionen aus gekauftem Dampf
Quelle: BWA
Sehr präzise


5,37 t CO2e
Scope 2.1 Indirekte Emissionen aus gekauftem Strom
Quelle: BWA
Vorläufig

5,67 t CO2e
Scope 2.2 Indirekte Emissionen aus Fernwärme/-kälte
Quelle: BWA
Präzise

Bearbeiten
Bearbeiten

“Bitte beachten Sie: Aktuell ist keine Berechnung der
Emissionen für die Verbrennung von Holzelementen möglich.”

S. Jones
Weber Logistik

Scope 3
Nachgelagerte Emissionen
-- t CO2e
Bald verfügbar!


Direct emissions from combustion processes of stationary facilities (heating oil, natural gas)
Scope 1.1
Period: January 2022
To improve the accuracy of your calculation, choose one of the following options:

Please provide your company's natural gas costs and/or heating oil costs for the specified period:

-
Oil costs
€

-
€
Gas costs
If you fill in this data, your result will be accurate

Please provide your company's natural gas consumption and/or heating oil consumption for the specified period:
If you fill in this data, your result will be very accurate
Gas consumption

1,000
kWh
I
-
Oil consumption
Back to overview
Save
Preliminary
Ihre CO2-Bilanz
Berechnet mit bwa_beispiel.pdf
Berechnung
CO2-Bilanz
Upload BWA
Ergebnishistorie
CO2-Bilanz herunterladen

CO2e
für März 2021
11.155,68 t
4.000,20 t
4.000,20 t
2.906,20 t
Scope 1
Scope 2
Scope 3

Auswirkungen


Details

Scope 1
Direkte Emissionen
0,075 t CO2e
Scope 1.4 Direkte Emissionen aus besonderen Produktionsprozessen (nur für wenige Branchen relevant)
Quelle: BWA
Vorläufig
-- kg CO2e
Scope 1.3 Direkte Emissionen flüchtiger Gase, Leckagen und undichte Leitungen durch den Einsatz von Klimaanlagen
Quelle: BWA

5,37 t CO2e
Scope 1.1 Direkte Emissionen aus Verbrennungsprozessen stationärer Anlagen (Heizöl, Erdgas)
Quelle: BWA
Vorläufig

4.000,20 t CO2e
5,67 t CO2e
Scope 1.2 Direkte Emissionen durch Kraftstoffverbrauch selbstgenutzter Fahrzeuge (Leasing und Eigentum)
Quelle: BWA
Präzise

Bearbeiten

Diese Kategorie ist nicht editierbar.
Bearbeiten
Sehr präzise

Scope 3
Vorgelagerte Emissionen
0,075 t CO2e
Scope 1.4 Direkte Emissionen aus besonderen Produktionsprozessen (nur für wenige Branchen relevant)
Quelle: BWA
Tentavive
- kg CO2e
Scope 1.3 Direkte Emissionen flüchtiger Gase, Leckagen und undichte Leitungen durch den Einsatz von Klimaanlagen
Quelle: BWA
Very precise
5,37 t CO2e
Scope 3.1 Emissionen der eingekauften Waren und Dienstleistungen (Rohstoffgewinnung, Produktion und Transport)
Quelle: BWA
Vorläufig
Edit
2.906,20 t CO2e
5,67 t CO2e
Scope 1.2 Direkte Emissionen durch Kraftstoffverbrauch selbstgenutzter Fahrzeuge (Leasing und Eigentum)
Quelle: BWA
Precise
Edit
This category is not
possible to edit
Scope 2
Indirekte Emissionen durch bezogene Energien
4.000,20 t CO2e
1,37 t CO2e
Scope 2.3 Indirekte Emissionen aus gekauftem Dampf
Quelle: BWA
Sehr präzise

5,37 t CO2e
Scope 2.1 Indirekte Emissionen aus gekauftem Strom
Quelle: BWA
Vorläufig
5,67 t CO2e
Scope 2.2 Indirekte Emissionen aus Fernwärme/-kälte
Quelle: BWA
Präzise

Bearbeiten
Bearbeiten
“Bitte beachten Sie: Aktuell ist keine Berechnung der
Emissionen für die Verbrennung von Holzelementen möglich.”
S. Jones
Weber Logistik
Scope 3
Nachgelagerte Emissionen
-- t CO2e
Bald verfügbar!

Direct emissions from combustion processes of stationary installations (heating oil, natural gas)
Scope 1.1
To improve the accuracy of your calculation, choose one of the following options:

Please provide your company's natural gas costs and/or heating oil costs for the specified period:
-
Gas costs
€
-
€
Oil costs
If you fill in this data, your result will be accurate
Please provide your company's natural gas consumption and/or heating oil consumption for the specified period:
If you fill in this data, your result will be very accurate
Gas consumption
-
kWh

I
-
Oil consumption
Back to overview
Save
Preliminary
Ihre CO2-Bilanz
Berechnet mit bwa_beispiel.pdf

Berechnung
CO2-Bilanz

Upload BWA
Ergebnishistorie

CO2-Bilanz herunterladen

CO2e
für März 2021
11.155,68 t
4.000,20 t
4.000,20 t
2.906,20 t

Scope 1

Scope 2

Scope 3


Auswirkungen


Details


Scope 1
Direkte Emissionen


0,075 t CO2e
Scope 1.4 Direkte Emissionen aus besonderen Produktionsprozessen (nur für wenige Branchen relevant)
Quelle: BWA
Vorläufig

-- kg CO2e
Scope 1.3 Direkte Emissionen flüchtiger Gase, Leckagen und undichte Leitungen durch den Einsatz von Klimaanlagen
Quelle: BWA


5,37 t CO2e
Scope 1.1 Direkte Emissionen aus Verbrennungsprozessen stationärer Anlagen (Heizöl, Erdgas)
Quelle: BWA
Vorläufig

4.000,20 t CO2e

5,67 t CO2e
Scope 1.2 Direkte Emissionen durch Kraftstoffverbrauch selbstgenutzter Fahrzeuge (Leasing und Eigentum)
Quelle: BWA
Präzise
Bearbeiten


Diese Kategorie ist nicht editierbar.

Bearbeiten
Sehr präzise


Scope 3
Vorgelagerte Emissionen


0,075 t CO2e
Scope 1.4 Direkte Emissionen aus besonderen Produktionsprozessen (nur für wenige Branchen relevant)
Quelle: BWA
Tentavive

- kg CO2e
Scope 1.3 Direkte Emissionen flüchtiger Gase, Leckagen und undichte Leitungen durch den Einsatz von Klimaanlagen
Quelle: BWA
Very precise


5,37 t CO2e
Scope 3.1 Emissionen der eingekauften Waren und Dienstleistungen (Rohstoffgewinnung, Produktion und Transport)
Quelle: BWA
Vorläufig

Edit

2.906,20 t CO2e

5,67 t CO2e
Scope 1.2 Direkte Emissionen durch Kraftstoffverbrauch selbstgenutzter Fahrzeuge (Leasing und Eigentum)
Quelle: BWA
Precise

Edit


This category is not
possible to edit


Scope 2
Indirekte Emissionen durch bezogene Energien
4.000,20 t CO2e


1,37 t CO2e
Scope 2.3 Indirekte Emissionen aus gekauftem Dampf
Quelle: BWA
Sehr präzise


5,37 t CO2e
Scope 2.1 Indirekte Emissionen aus gekauftem Strom
Quelle: BWA
Vorläufig

5,67 t CO2e
Scope 2.2 Indirekte Emissionen aus Fernwärme/-kälte
Quelle: BWA
Präzise
Bearbeiten
Bearbeiten

“Bitte beachten Sie: Aktuell ist keine Berechnung der
Emissionen für die Verbrennung von Holzelementen möglich.”

S. Jones
Weber Logistik

Scope 3
Nachgelagerte Emissionen
-- t CO2e
Bald verfügbar!


Direct emissions from volatile gases, leaks, and faulty pipes when using air conditioning systems
Scope 1.3
Period: January 2022
To improve the accuracy of your calculation, choose one of the following options:

Please specify the total area cooled by air conditioning in your company.

-
Total area
sqm
If you fill in this data, your result will be very accurate

Please specify the total output of the air conditioning systems in your company for the selected period.
If you fill in this data, your result will be very accurate
Air conditioning systems

-
kWh
Back to overview
Save
Preliminary
Ihre CO2-Bilanz
Berechnet mit bwa_beispiel.pdf

Berechnung
CO2-Bilanz
Upload BWA
Ergebnishistorie
CO2-Bilanz herunterladen

CO2e
für März 2021
11.155,68 t
4.000,20 t
4.000,20 t
2.906,20 t
Scope 1
Scope 2
Scope 3

Auswirkungen

Details

Scope 1
Direkte Emissionen
0,075 t CO2e
Scope 1.4 Direkte Emissionen aus besonderen Produktionsprozessen (nur für wenige Branchen relevant)
Quelle: BWA
Vorläufig
-- kg CO2e
Scope 1.3 Direkte Emissionen flüchtiger Gase, Leckagen und undichte Leitungen durch den Einsatz von Klimaanlagen
Quelle: BWA

5,37 t CO2e
Scope 1.1 Direkte Emissionen aus Verbrennungsprozessen stationärer Anlagen (Heizöl, Erdgas)
Quelle: BWA
Vorläufig

4.000,20 t CO2e
5,67 t CO2e
Scope 1.2 Direkte Emissionen durch Kraftstoffverbrauch selbstgenutzter Fahrzeuge (Leasing und Eigentum)
Quelle: BWA
Präzise
Bearbeiten
Diese Kategorie ist nicht editierbar.
Bearbeiten
Sehr präzise
Scope 3
Vorgelagerte Emissionen
0,075 t CO2e
Scope 1.4 Direkte Emissionen aus besonderen Produktionsprozessen (nur für wenige Branchen relevant)
Quelle: BWA
Tentavive
- kg CO2e
Scope 1.3 Direkte Emissionen flüchtiger Gase, Leckagen und undichte Leitungen durch den Einsatz von Klimaanlagen
Quelle: BWA
Very precise

5,37 t CO2e
Scope 3.1 Emissionen der eingekauften Waren und Dienstleistungen (Rohstoffgewinnung, Produktion und Transport)
Quelle: BWA
Vorläufig
Edit
2.906,20 t CO2e
5,67 t CO2e
Scope 1.2 Direkte Emissionen durch Kraftstoffverbrauch selbstgenutzter Fahrzeuge (Leasing und Eigentum)
Quelle: BWA
Precise

Edit
This category is not
possible to edit

Scope 2
Indirekte Emissionen durch bezogene Energien
4.000,20 t CO2e
1,37 t CO2e
Scope 2.3 Indirekte Emissionen aus gekauftem Dampf
Quelle: BWA
Sehr präzise

5,37 t CO2e
Scope 2.1 Indirekte Emissionen aus gekauftem Strom
Quelle: BWA
Vorläufig

5,67 t CO2e
Scope 2.2 Indirekte Emissionen aus Fernwärme/-kälte
Quelle: BWA
Präzise
Bearbeiten
Bearbeiten
“Bitte beachten Sie: Aktuell ist keine Berechnung der
Emissionen für die Verbrennung von Holzelementen möglich.”
S. Jones
Weber Logistik
Scope 3
Nachgelagerte Emissionen
-- t CO2e
Bald verfügbar!


Direct emissions from fuel consumption of self-used vehicles (leasing and ownership)
Scope 1.2
Period: January 2022
To improve the accuracy of your calculation, please select one of the following options:

Please specify the total litres of diesel/petrol consumed during the selected period by all vehicles used by your company (leasing or ownership).

-
Diesel
l
-
l
Petrol
If you fill in this data, your result will be very accurate
Estimate the total kilometres driven during the selected period by all vehicles used by your company (leasing or ownership).
If you fill in this data, your result will be accurate
Kilometres driven

-
km

Please specify the total kilometres driven during the selected period by all vehicles used by your company (leasing or ownership).
If you fill in this data, your result will be very accurate
Kilometres driven
-
km
Back to overview
Save
Accurate
-
October 2022


Extracted Data
Step 2 of 2

Calculation
CO2 Balance

Extracted Data
Result History
Company Profile
eye

S. Jones
Weber Logistics
Gas

3,000
£
Electricity
Oil

Business Trips


4,240
Electricity, Water (x%)
2,000
£
3,987
Position Text (x%)
6,000
£

4,240
Gas, Electricity, Water (x%)
1,500
£
3,987
Position Text (x%)
Vehicle Costs
4,500
£
3,987
Position Text (x%)
1,500
£

4,923
Energy Sources (x%)
500
£
9,294
Heating Oil (x%)


To CO2 Balance

Back
save
trash
save
trash
save
trash
save
trash
save
trash
save
trash
save
trash


Extracted Data
Step 2 of 2

Calculation
CO2 Balance

Extracted Data
Result History

S. Jones
Weber Logistics
Company Profile
eye
Gas
(5,000 €)


4240
Gas, Electricity, Water (x%)
3,000
€
trash
save
3987
Position Text (x%)
2,000
€
trash
save
Oil
(2,000 €)
4923
Energy Materials (x%)
1,500
€
trash
save
9294
Heating Oil (x%)
500
€
trash
save
Electricity
(6,000 €)
4240
Gas, Electricity, Water (x%)
6,000
€
trash
save

To the CO2 Balance

Back
Upload & evaluate BWA
Step 1 of 2

S. Jones
Weber Logistics


Drag & drop your BWA here
or use the “Select File” button.
Please use a .pdf format.


Select previously uploaded file

Select file

Select file
Calculation
CO2 balance

Upload BWA
Result history
BWA hochladen & berechnen
Schritt 1 von 2

Berechnung
CO2-Bilanz
Upload BWA
Ergebnishistorie

S. Jones
Weber Logistik

Sie nutzen aktuell gecco₂ Pro. Damit können Sie für 12 Monate unbegrenzt viele Detail-Berechnungen Ihres CO₂-Abdrucks durchführen.

Aktuell werden nur .pdf Formate unterstützt
BWA hier reinziehen
oder
Datei auswählen
Anzahl verfügbarer Basic-Berechnungen: 1

Zurück

Berechnung starten
Anforderungen an Ihre BWA:
1
Nutzen Sie für den Upload eine BWA mit Summen- und Saldenliste, z.B. von DATEV, Addison oder Lexware.
Die Verwendung der Standardkontenrahmen SK03 oder SK04 erleichtert zudem das Auslesen der Datei.


DEVELOPED FOR
MY ROLE
- User Research
(interviews, desk research, stakeholder workshops)
- End-to-End UX/UI Design
- Usability Testing & Iteration
- Design System Alignment
- Cross-functional Collaboration (Product, Developers)
- Design Handover & QA
PROJECT DURATION
- 10 Months (Discovery -Launch)
- 2025
CLIENTS
- VolksbankPur
- Sparkasse, and Partners

Digital CO₂ Solution for Volksbank Pur
Trend





0.005
0.004
0.003
0.002
0.001
0.000
0.005
0.004
0.003
0.002
0.001
0.000
6 Months
1 Year
5 Years
10 Years
2020
2022
2023

2019
2021

Month CO2e (t)
Period/Year CO2e (t)
Time








Month

Period/Year

Period/Year (Jan 2024 - Sep 2024): 123.23 t

Month (Jan 2021): 0.0030 t
Your industry comparison
Calculated with bwa_example.pdf
Result

Industry average
Your result





3,056.20 t CO2e


30%
4,000.20 t CO2e
1,300.20 t CO2e
50%
6,213.20 t CO2e
950.20 t CO2e

895 t CO2e
50%
20%
55%
45%
CO2 emissions

per employee

per €100,000 revenue


Download CO2 balance

800 trees


Calculation CO2 balance
Upload BWA
Extracted data

Result
Result history
Scope 1


Scope 2


Scope 3


would need to be planted to offset your CO2 balance